目录
metricbeat监控简介
从 Logstash 8.x 开始,Logstash 的许多旧配置项(如 http.host、http.port、甚至一些 xpack.monitoring.*)已经被废弃,到了 9.x(如 9.0.1)版本,它们已彻底被移除或由新的设置方式取代。
如自带的legacy collectors监控,在8.0版本已经弃用,虽然可以用,但是在kibana 面板生产的监控索引为旧版格式:
.monitoring-es-7-2025.05.28
.monitoring-kibana-7-2025.05.28
.monitoring-logstash-7-2025.05.28
默认的生命周期,也不在包含旧版的模版、索引,需要自己创建生命周期绑定旧的过时模版。
官方现在推荐的两种监控:
1:Elastic Agent+Fleet Server :更强大,可集中管理所有 agent、自动收集系统日志、指标、APM 等。
2: Metricbeat:更灵活,可替代 Elastic Agent,仅部署 Metricbeat 发送节点监控信息。
3: legacy collectors自带监控,已经弃用。
仅仅为了基本的监控功能,安装 Elastic Agent + Fleet Server 确实显得过于复杂。
所有这里用中间选项Metricbeat,但未来逐步会被 Elastic Agent 替代。
ELK目录机构和yml文件
基本目录结构:
elk/
├── docker-compose.yml
├── elasticsearch/
│   └── config/
│       └── elasticsearch.yml
├── kibana/
│   └── config/
│       └── kibana.yml
├── logstash/
│   ├── config/
│   │   └── logstash.yml
│   └── pipeline/
│       └── logstash.conf
└── logs/
│   ├── elasticsearch/
│   ├── kibana/
│   └── logstash/
└── metricbeat
    ├── metricbeat.yml
    └── modules.d
docker-compose.yml
version: '3.8'

services:
  elasticsearch:
    image: docker.elastic.co/elasticsearch/elasticsearch:9.0.1
    container_name: elasticsearch
    environment:
      - discovery.type=single-node
      - ELASTIC_PASSWORD=qwe123
      - xpack.security.enabled=true
      - xpack.security.http.ssl.enabled=false
      - xpack.security.transport.ssl.enabled=false
    ports:
      - "9200:9200"
    volumes:
      - ./elasticsearch/config/elasticsearch.yml:/usr/share/elasticsearch/config/elasticsearch.yml
      - ./elasticsearch/data:/usr/share/elasticsearch/data
      - ./logs/elasticsearch:/usr/share/elasticsearch/logs
    networks:
      - elk

  kibana:
    image: docker.elastic.co/kibana/kibana:9.0.1
    container_name: kibana
    environment:
      - ELASTICSEARCH_HOSTS=http://elasticsearch:9200
      - ELASTICSEARCH_USERNAME=kibana_system
      - ELASTICSEARCH_PASSWORD=kibana123
    ports:
      - "5601:5601"
    volumes:
      - ./kibana/config/kibana.yml:/usr/share/kibana/config/kibana.yml
      - ./logs/kibana:/usr/share/kibana/logs
    depends_on:
      - elasticsearch
    networks:
      - elk

  logstash:
    image: docker.elastic.co/logstash/logstash:9.0.1
    container_name: logstash
    volumes:
      - ./logstash/config/logstash.yml:/usr/share/logstash/config/logstash.yml
      - ./logstash/pipeline:/usr/share/logstash/pipeline
      - ./logs/logstash:/usr/share/logstash/logs
    ports:
      - "5044:5044"    # Beats input
      - "9600:9600"        #api端口,用于metricbeat监控采集
    depends_on:
      - elasticsearch
    networks:
      - elk

  metricbeat:
    image: docker.elastic.co/beats/metricbeat:9.0.1
    container_name: metricbeat
    user: root
    depends_on:
      - elasticsearch
      - kibana
      - logstash
    volumes:
      - ./metricbeat/metricbeat.yml:/usr/share/metricbeat/metricbeat.yml:ro
      - ./metricbeat/modules.d:/usr/share/metricbeat/modules.d:ro
    ports:
      - "5066:5066" #开启配置api端口后启用
    networks:
      - elk

networks:
  elk:
    driver: bridge
elasticsearch 配置文件
配置文件
创建文件夹及配置文件:
mkdir elasticsearch/config
vim elasticsearch/config/elasticsearch.yml
cluster.name: "docker-cluster"
network.host: 0.0.0.0
http.port: 9200

#关闭默认的自身监控
xpack.monitoring.collection.enabled: false

#开启安全密码认证,docker-compose.yml配置后也可以不配置,没有则启用
xpack.security.enabled: true
xpack.security.http.ssl.enabled: false
xpack.security.transport.ssl.enabled: false
重置系统账号密码
可以先启动elasticsearch,配置相关账号。
配置系统账号密码:
方式一:使用 elasticsearch 自带工具交互式重置密码
以系统账号kibana_system为例
docker exec -it elasticsearch /bin/bash
bin/elasticsearch-reset-password -u kibana_system -i
方式二:在使用API 重置密码
remote_monitoring_user系统账号为例,用于metricbeat 服务采集数据。
#重置密码:
curl -u elastic:qwe123 -X PUT "http://localhost:9200/_security/user/remote_monitoring_user/_password" -H "Content-Type: application/json" -d '{
  "password": "remote1234"
}'

#查看登录账户是否可用
curl -XGET 'http://remote_monitoring_user:remote1234@localhost:9200/_cluster/health?pretty'

#如显示类似如下,没错误即可正常使用
{
  "cluster_name" : "docker-cluster",
  "status" : "yellow",
  "timed_out" : false,
  "number_of_nodes" : 1,
  "number_of_data_nodes" : 1,
  "active_primary_shards" : 42,
  "active_shards" : 42,
  "relocating_shards" : 0,
  "initializing_shards" : 0,
  "unassigned_shards" : 1,
  "unassigned_primary_shards" : 0,
  "delayed_unassigned_shards" : 0,
  "number_of_pending_tasks" : 0,
  "number_of_in_flight_fetch" : 0,
  "task_max_waiting_in_queue_millis" : 0,
  "active_shards_percent_as_number" : 97.67441860465115
}
kibana 配置文件
mkdir kibana/config
vim kibana/config/kibana.yml
server.name: kibana
server.host: "0.0.0.0"
elasticsearch.hosts: [ "http://elasticsearch:9200" ]

#关闭默认的自身监控
monitoring.kibana.collection.enabled: false

#用来支持告警、报告等功能,不配置的话,面板监控报错 “Monitoring 请求错误78”
xpack.encryptedSavedObjects.encryptionKey: "zJ+sPIy8LLD8e58L9toWX6GotPMr5JrK"
#默认语言,中简体
i18n.locale: "zh-CN"
上面的encryptionKey必须是长度为 32 的字符串,可用以下命令生成
openssl rand -base64 32 | cut -c1-32
logstash 配置文件
logstash 有两个配置文件,1个为系统配置文件:logstash.yml,1个为处理数据流配置文件:logstash.conf
系统配置文件
mkdir logstash/config
vim logstash/config/logstash.yml
#监控日志级别
log.level: info
#关闭自身监控
monitoring.enabled: false
#开启api端口
api.http.host: "0.0.0.0"
api.http.port: 9600

#加入的监控集群(上面es配置的集群docker-cluster的uuid)
monitoring.cluster_uuid: GuZRw-10QzueZyaIszr7HQ
上面的cluster_uuid可用命令查询:
#kibana面板 >> 管理>> 开发工具中,输入可获得集群名称的uuid
GET /_cluster/stats

#如果elastic已经启动,也可以在服务器上运行命令查看,password为es设置的密码
curl -u elastic:password -X GET "http://localhost:9200/_cluster/stats?pretty" -H "Content-Type: application/json"
数据流配置文件
mkdir logstash/pipeline
vim logstash/pipeline/logstash.conf
基础启动配置,后续根据日志调整
input {
  beats {
    port => 5044
  }
}

output {
  elasticsearch {
    hosts => ["http://elasticsearch:9200"]
    user => "elastic"
    password => "qwe123"
    index => "logstash-%{+YYYY.MM.dd}"
    ssl_enabled => false
  }
}
数据流用户,需要有写的权限,系统自带的logstash_system 权限不够,所以这里用elastic账号。
metricbeat配置文件
vim metricbeat/metricbeat.yml
#开启api服务,用于收集自己的监控数据
http:
  enabled: true
  host: "0.0.0.0"
  port: 5066

#关闭自身默认监控
monitoring.enabled: false
#加入elastic集群uuid
monitoring.cluster_uuid: "GuZRw-10QzueZyaIszr7HQ"

#配置基础监控模块,elastic和kibana配置好就可以了。
metricbeat.config.modules:
  path: ${path.config}/modules.d/*.yml
  reload.enabled: false

output.elasticsearch:
  hosts: ["http://elasticsearch:9200"]
  username: "elastic"
  password: "qwe123"

setup.kibana:
  host: "http://kibana:5601"
  username: "kibana_system"
  password: "kibana123"

#自定义监控服务模块
#metricbeat.modules:
#  - module: elasticsearch
#    xpack.enabled: true
#    period: 10s
#    hosts: ["http://elasticsearch:9200"]
#    username: "elastic"
#    password: "qwe123"

#  - module: kibana
#    xpack.enabled: true
#    period: 10s
#    hosts: ["http://kibana:5601"]
#    username: "kibana_system"
#    password: "kibana123"

#  - module: logstash
#    xpack.enabled: true
#    metricsets:
#      - node
#      - node_stats
#    period: 10s
#    hosts: ["http://logstash:9600"]
    #username: "user"
    #password: "secret"
服务模块说明
关于metricbeat.config.modules 和 metricbeat.modules 两个模块说明:
metricbeat.config.modules :动态加载配置文件的方式
- 模块配置分离:每个模块的配置可以单独写在
modules.d/目录中。 - 支持动态重新加载(如果
reload.enabled: true)。 - 适用于 模块多、配置复杂、希望热更新 的场景。
- Elastic 官方的推荐方式,默认启用。
metricbeat.modules :最直接和静态的配置方式
- 静态配置:写死在主配置文件(如
metricbeat.yml)中。 - 适用于简单场景,尤其是配置少、改动不频繁的环境。
- 所有模块配置必须在启动前写好。
- 修改配置后,需要重启 Metricbeat。
这里采用metricbeat.config.modules,modules.d/ 已经默认包含所有的配置文件。
metricbeat.config.modules配置
配置好后,用命令开启对应的服务即可。
#启动监控服务的模块
metricbeat modules enable logstash-xpack

#docker需要进入容器启动
docker exec -it metricbeat /bin/bash
./metricbeat modules enable logstash-xpack

#查看已经启动的服务模块
./metricbeat modules list
系统自带modules.d中所有模版,默认监控都是localhost,所以对于docker容器中,还需要更改监控的地址host。
对于容器中,修改不是很方便,所以可以直接挂载到宿主机操作。
对于docker-compose.yml 中挂载路径/usr/share/metricbeat/modules.d,先注释掉,启动复制出来在重新开启挂载。
#复制所以文件到宿主机
docker cp metricbeat:/usr/share/metricbeat/modules.d  ./metricbeat

#复制完成后,宿主机存在modules.d
root@ubuntu-elk:/opt/elk# ls metricbeat/
metricbeat.yml  modules.d
root@ubuntu-elk:/opt/elk#
在次修改docker-compose.yml的 metricbeat 配置挂载目录。
  metricbeat:
    image: docker.elastic.co/beats/metricbeat:9.0.1
    container_name: metricbeat
    user: root
    depends_on:
      - elasticsearch
      - kibana
      - logstash
    volumes:
      - ./metricbeat/metricbeat.yml:/usr/share/metricbeat/metricbeat.yml:ro
      #先启动metricbeat后,复制出来,在取消注释,然后挂载
      #- ./metricbeat/modules.d:/usr/share/metricbeat/modules.d:ro
    ports:
      - "5066:5066" #开启配置api端口后启用
    networks:
      - elk
重启服务后,在宿主机修改相关的模版,host 和账号密码。
这里用上面重置的系统账户remote_monitoring_user,密码即可。
当然也可以直接用elastic 账号,但是这个账号权限太大,不安全,remote_monitoring_user是专门为监控设置的,权限刚才足够。
root@ubuntu-elk:/opt/elk# cat metricbeat/modules.d/elasticsearch-xpack.yml
# Module: elasticsearch
# Docs: https://www.elastic.co/guide/en/beats/metricbeat/main/metricbeat-module-elasticsearch.html
- module: elasticsearch
  xpack.enabled: true
  period: 10s
  hosts: ["http://elasticsearch:9200"]
  username: "remote_monitoring_user"
  password: "remote1234"
  #api_key: "foo:bar"

root@ubuntu-elk:/opt/elk# cat metricbeat/modules.d/kibana-xpack.yml
# Module: kibana
# Docs: https://www.elastic.co/guide/en/beats/metricbeat/main/metricbeat-module-kibana.html
- module: kibana
  xpack.enabled: true
  period: 10s
  hosts: ["http://kibana:5601"]
  #basepath: ""
  username: "remote_monitoring_user"
  password: "remote1234"
  #api_key: "foo:bar"

root@ubuntu-elk:/opt/elk# cat metricbeat/modules.d/logstash-xpack.yml
# Module: logstash
# Docs: https://www.elastic.co/guide/en/beats/metricbeat/main/metricbeat-module-logstash.html
- module: logstash
  xpack.enabled: true
  period: 10s
  hosts: ["http://logstash:9600"]
  username: "remote_monitoring_user"
  password: "remote1234"

root@ubuntu-elk:/opt/elk# cat metricbeat/modules.d/beat-xpack.yml
# Module: beat
# Docs: https://www.elastic.co/guide/en/beats/metricbeat/main/metricbeat-module-beat.html
- module: beat
  xpack.enabled: true
  period: 10s
  hosts: ["http://metricbeat:5066"]
  username: "remote_monitoring_user"
  password: "remote1234"
启动后的配置文件,末尾没有.disabled,如下显示
root@ubuntu-elk:/opt/elk# ls metricbeat/modules.d/ -lh
total 284K
-rw-r--r-- 1 root root  356 Apr 30 06:53 activemq.yml.disabled
-rw-r--r-- 1 root root  915 Apr 30 06:53 aerospike.yml.disabled
...
-rw-r--r-- 1 root root  237 May 28 10:22 beat-xpack.yml
-rw-r--r-- 1 root root  209 Apr 30 06:53 beat.yml.disabled
-rw-r--r-- 1 root root  193 Apr 30 06:53 benchmark.yml.disabled
-rw-r--r-- 1 root root  197 Apr 30 06:53 couchdb.yml.disabled
-rw-r--r-- 1 root root 1.1K Apr 30 06:53 docker.yml.disabled
-rw-r--r-- 1 root root  309 Apr 30 06:53 dropwizard.yml.disabled
...
-rw-r--r-- 1 root root  289 May 27 18:34 elasticsearch-xpack.yml
-rw-r--r-- 1 root root  306 Apr 30 06:53 elasticsearch.yml.disabled
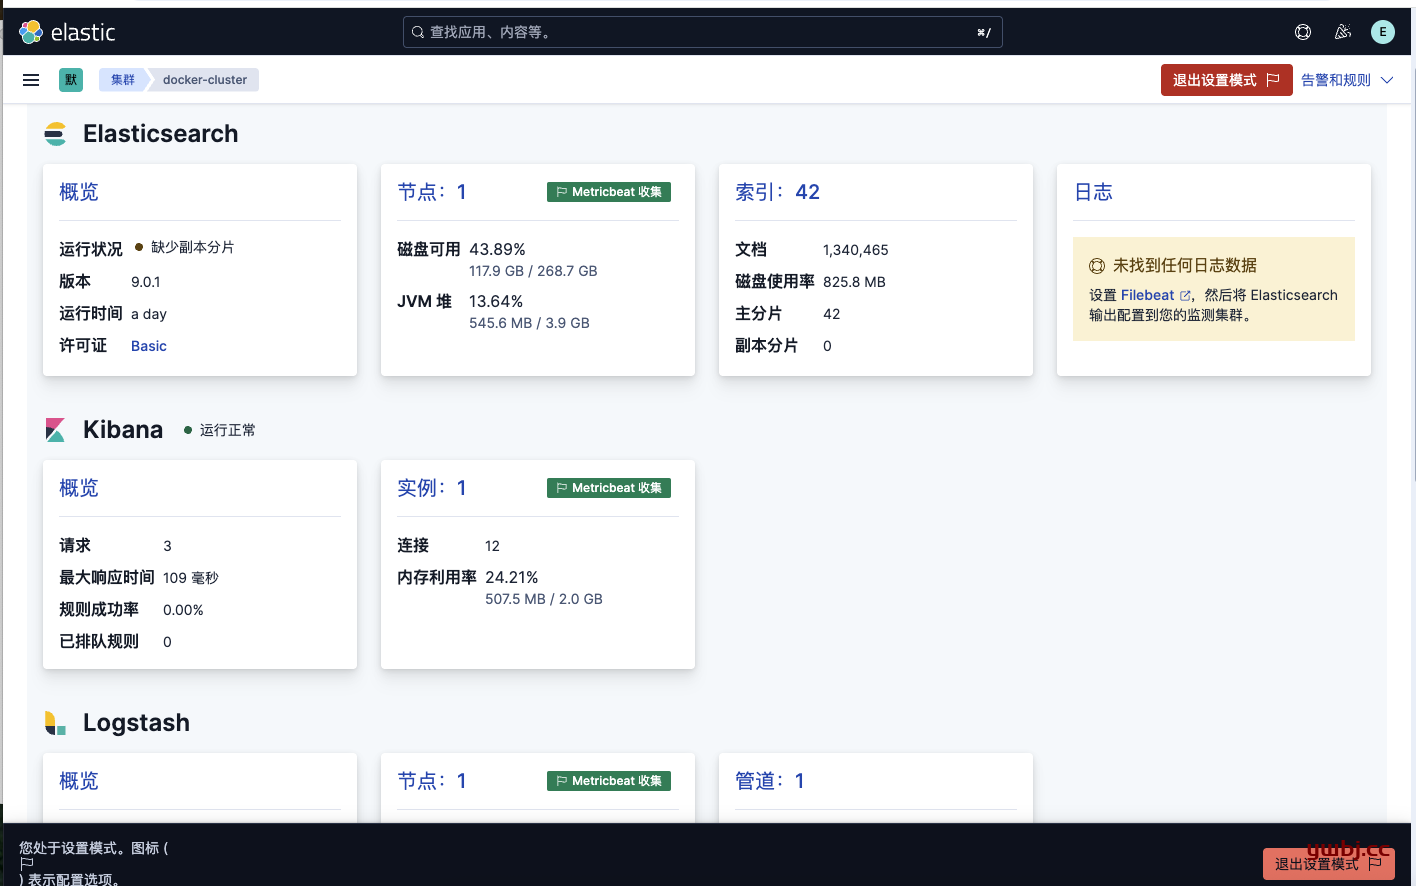
最后配置完成启动后,在监控面板,设置模式,可以看到已经是metricbeat收集

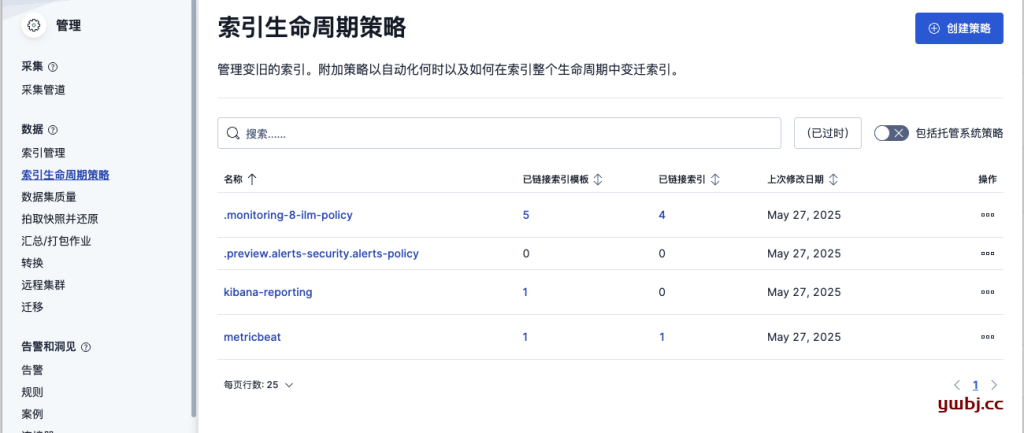
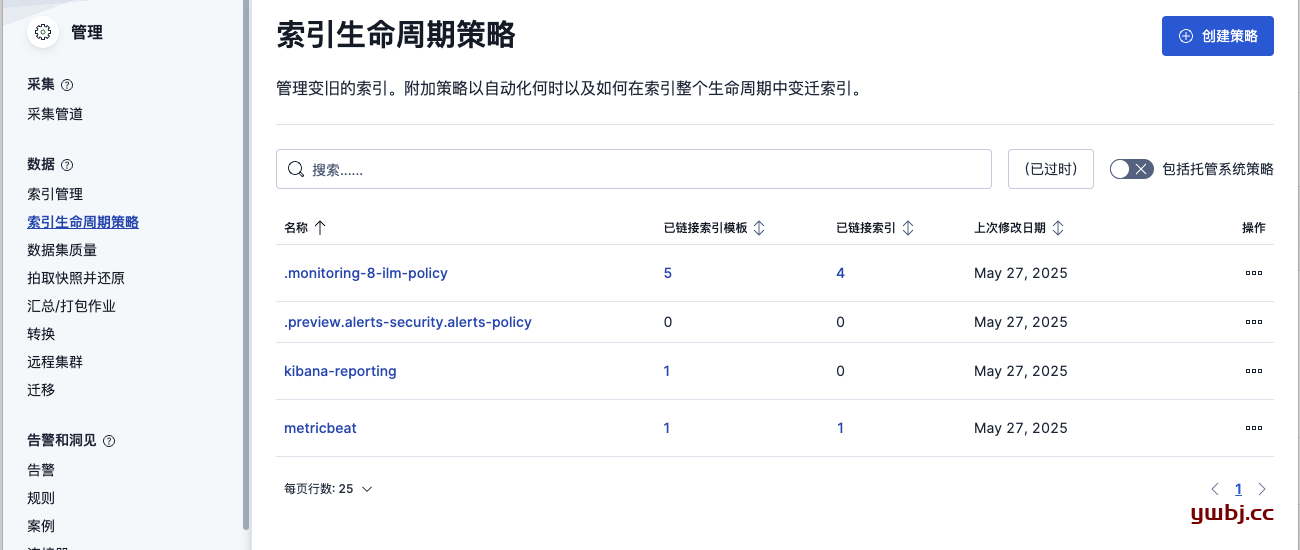
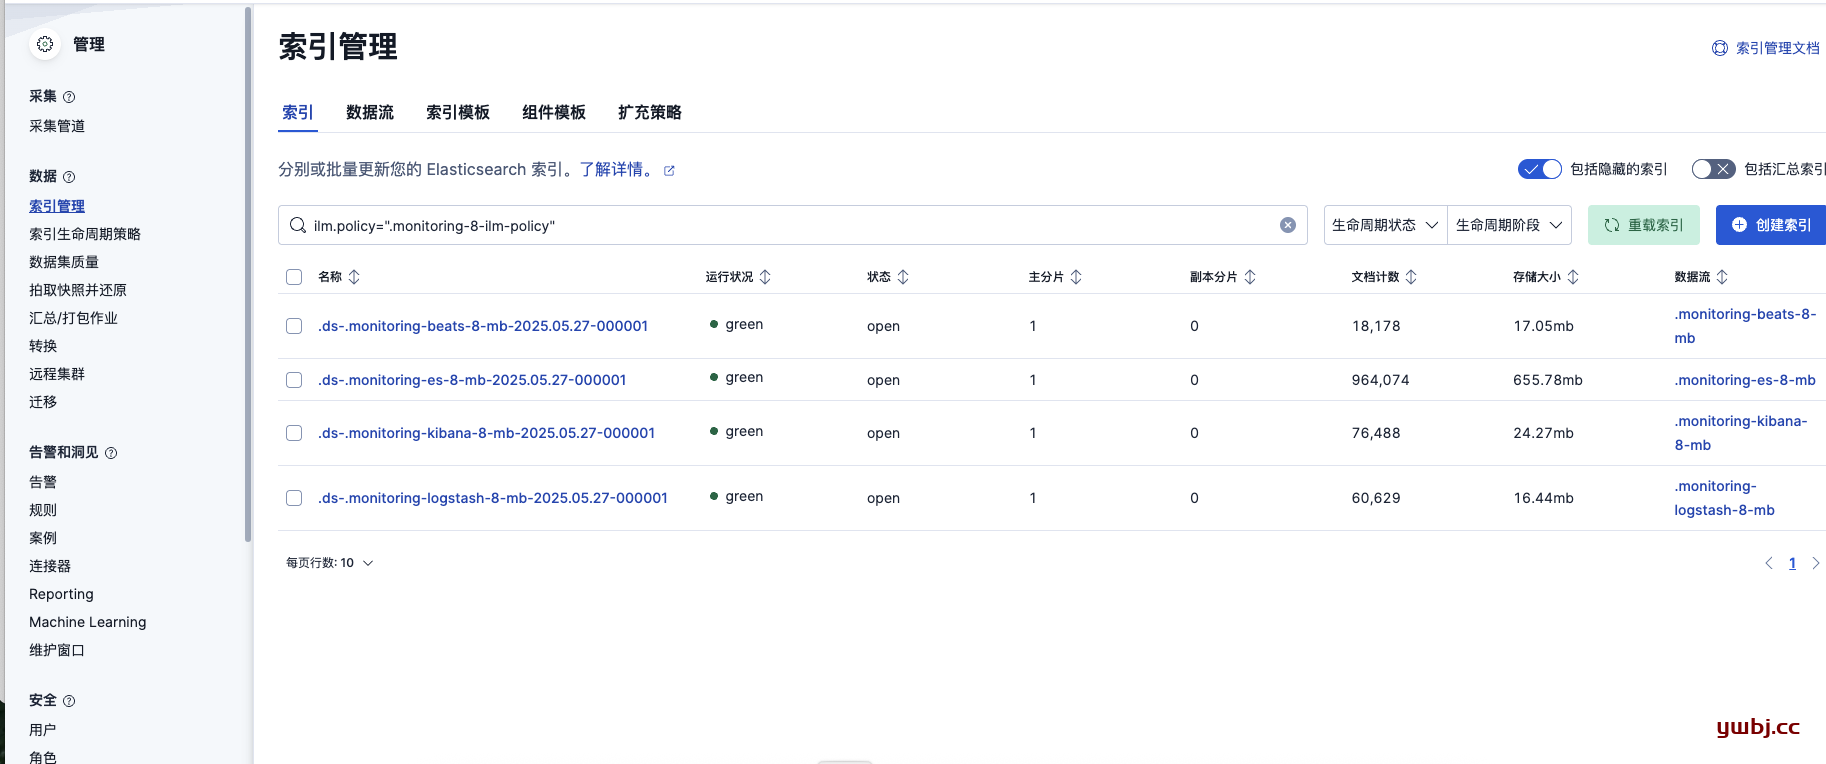
在默认索引周期策略 .monitoring-8-ilm-policy 中,默认绑定了监控日志索引,自动删除等操作,无需自己配置。
索引名称不在是旧版弃用的 .monitoring-es-7-* 格式,而是标准的 .monitoring-es-8-mb-* 索引名称。


Pingback引用通告: ELK日志收集,非ILM生命周期管理、ILM生命周期管理索引配置 - 运维笔记(ywbj.cc)
Pingback引用通告: ELK平替,OpenSearch + Fluent Bit日志管理系统 - 运维笔记(ywbj.cc)