目录
一、Prometheus 简介
gitlab官方地址:https://github.com/prometheus/prometheus
Prometheus(普罗米修斯)是一套开源的监控&报警&时间序列数据库的组合,由 SoundCloud 公司开发。
Prometheus 基本原理是通过 HTTP 协议周期性抓取被监控组件的状态,这样做的好处是任意组件只要提供 HTTP 接口就可以接入监控系统,不需要任何 SDK 或者其他的集成过程。这样做非常适合虚拟化环境比如 VM 或者 Docker 。
Prometheus 应该是为数不多的适合 Docker、Mesos、Kubernetes 环境的监控系统之一。
Prometheus 基础架构
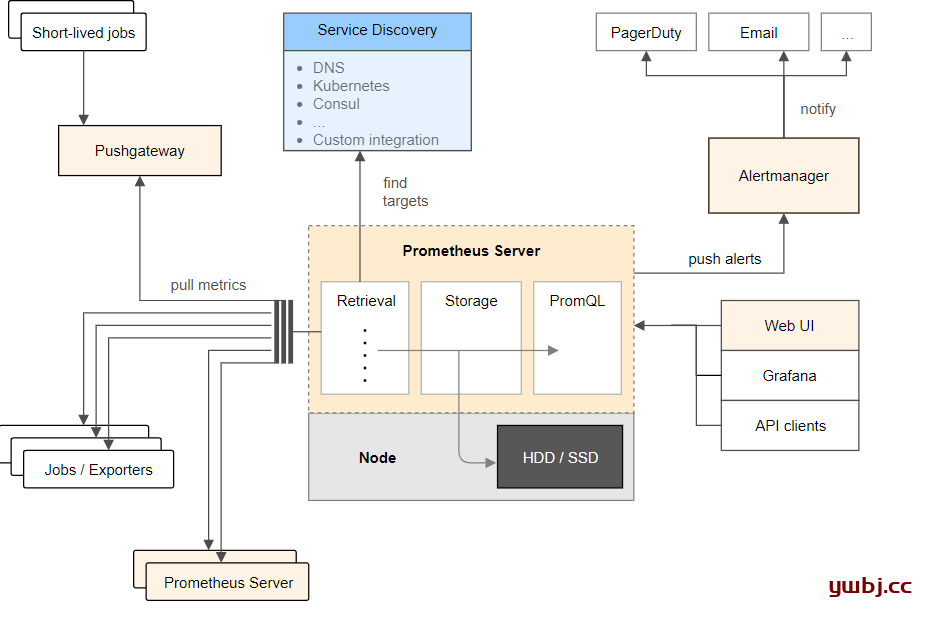
如上图,Prometheus 主要由以下部分组成:
- Prometheus Server:主要是负责存储、抓取、聚合、查询方面。(服务器端)
- Alertemanager:主要是负责实现报警功能。
- Pushgateway:主要是实现接收有 Client-push 过来的指标数据,在指定的时间间隔,有主程序来抓取。
- *_exporter:主要是负责采集物理机、中间件的信息。(客户端)
二、Prometheus 服务器端安装
准备工作:
服务器端:192.168.152.103 ubuntu
客户端:192.168.152.101 ubuntu
1:下载
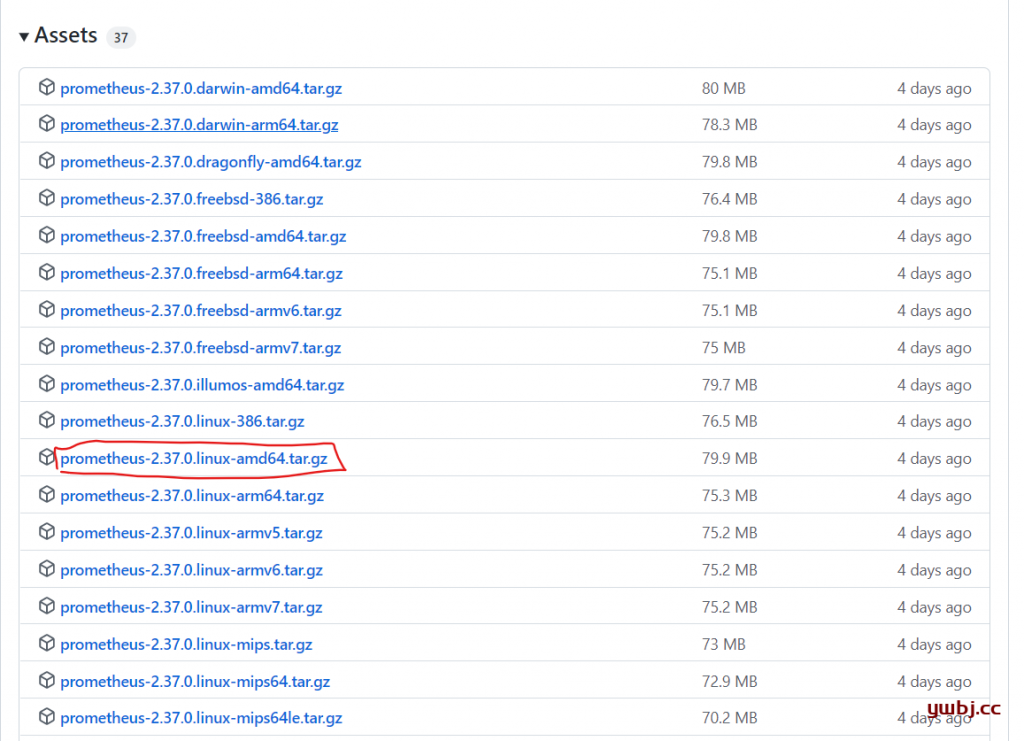
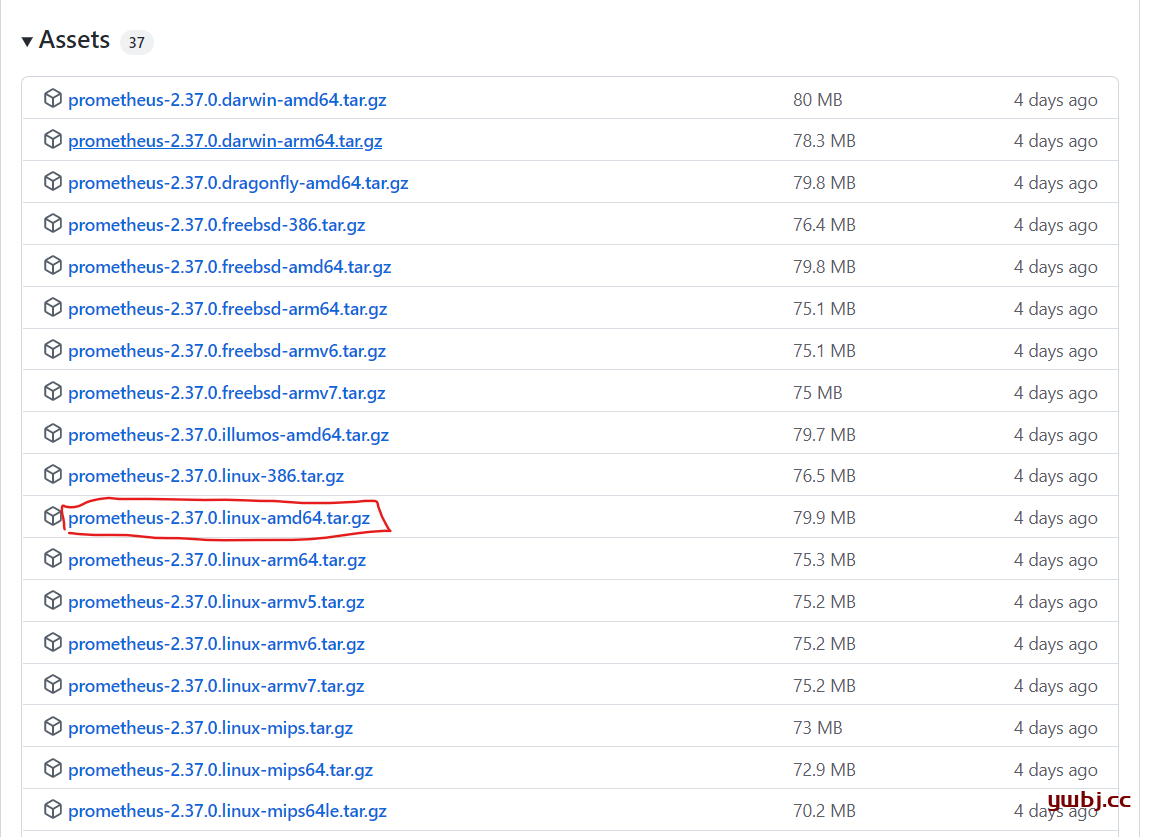
在192.168.152.103,服务器端下载地址:https://github.com/prometheus/prometheus/releases
找到自己Linux版本,我这里为Linux-amd64,大多数基本都是这个。
#下载
wget https://github.com/prometheus/prometheus/releases/download/v2.37.0/prometheus-2.37.0.linux-amd64.tar.gz
#解压
tar -zxvf  prometheus-2.37.0.linux-amd64.tar.gz
#重命名文件夹,名称太长,方便后续操作
mv prometheus-2.37.0.linux-amd64 prometheus
# 进入文件夹
cd prometheus/
查看文件可看到以下文件。
ubuntu@ubuntu:~/prometheus$ ls
console_libraries  consoles  LICENSE  NOTICE  prometheus  prometheus.yml  promtool
只需要关注 prometheus(启动文件), prometheus.yml(配置文件),这两个文件即可。
默认配置文件内容为
cat prometheus.yml
# my global config
global:
  scrape_interval: 15s # Set the scrape interval to every 15 seconds. Default is every 1 minute. 默认情况下,每15s拉取一次目标采样点数据。
  evaluation_interval: 15s # Evaluate rules every 15 seconds. The default is every 1 minute.每15秒评估一次规则。默认值为每1分钟
  # scrape_timeout is set to the global default (10s).

# Alertmanager configuration
alerting:
  alertmanagers:
    - static_configs:
        - targets:
          # - alertmanager:9093

# Load rules once and periodically evaluate them according to the global 'evaluation_interval'.
rule_files:
  # - "first_rules.yml"
  # - "second_rules.yml"

# A scrape configuration containing exactly one endpoint to scrape:
# Here it's Prometheus itself.
scrape_configs:
  # The job name is added as a label `job=<job_name>` to any timeseries scraped from this config.
  - job_name: "prometheus"

    # metrics_path defaults to '/metrics'
    # scheme defaults to 'http'.

    static_configs:
      - targets: ["localhost:9090"]
2:启动测试服务器
启动
./prometheus --config.file=prometheus.yml
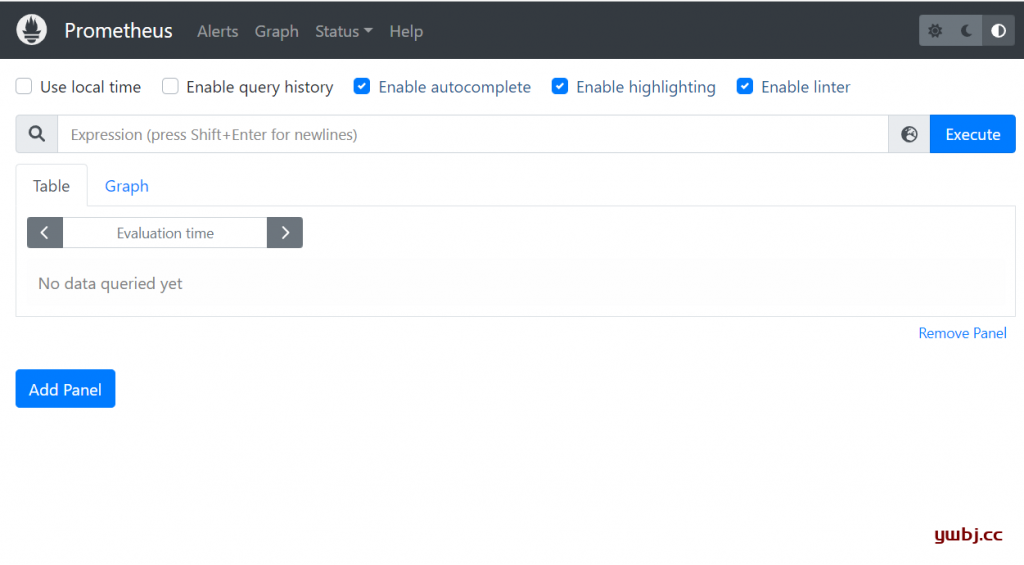
当启动 Prometheus 后,便可以通过 9090 端口来访问 Prometheus 自带的 UI 界面:
在浏览器打开 http://192.168.152.103:9090/,即可访问UI界面。
三、安装 Node_Exporter客户端
1:下载解压
在192.168.152.101,客户端下载地址:https://github.com/prometheus/node_exporter/releases
同样找到Linux-amd64这个版本,下载解压即可
#下载
wget https://github.com/prometheus/node_exporter/releases/download/v1.3.1/node_exporter-1.3.1.linux-amd64.tar.gz
#解压
tar -zxvf node_exporter-1.3.1.linux-amd64.tar.gz
#重命名
mv node_exporter-1.3.1.linux-amd64 node_exporter
2:启动Node_Exporter客户端
客户端,没有其他配置文件,默认直接启动即可
./node_exporter
启动后,默认监听端口为9100,在浏览器输入,192.168.152.101:9100可以查看访问 Client 的监控指标。
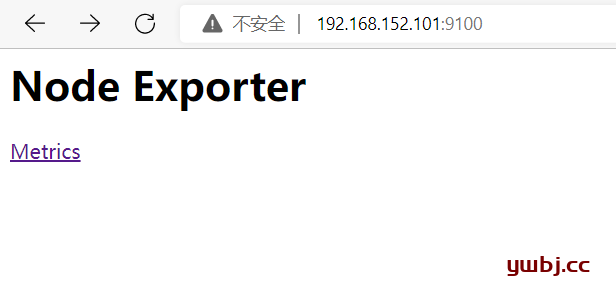
点击Metrics进入可以看到相关信息。
四、服务器添加连接客户端
只需要在服务器配置文件种,添加 job_name 即可,有几个客户端,就添加几个。名称自己取即可。
更改服务器配置文件
vim prometheus.yml
最后面添加即可。[‘192.168.152.101:9100’]为客户端信息。
# my global config
global:
  scrape_interval: 15s # Set the scrape interval to every 15 seconds. Default is every 1 minute. 默认情况下,每15s拉取一次目标采样点数据。
  evaluation_interval: 15s # Evaluate rules every 15 seconds. The default is every 1 minute.每15秒评估一次规则。默认值为每1分钟
  # scrape_timeout is set to the global default (10s).

# Alertmanager configuration
alerting:
  alertmanagers:
    - static_configs:
        - targets:
          # - alertmanager:9093

# Load rules once and periodically evaluate them according to the global 'evaluation_interval'.
rule_files:
  # - "first_rules.yml"
  # - "second_rules.yml"

# A scrape configuration containing exactly one endpoint to scrape:
# Here it's Prometheus itself.
scrape_configs:
  # The job name is added as a label `job=<job_name>` to any timeseries scraped from this config.
  - job_name: "prometheus"

    # metrics_path defaults to '/metrics'
    # scheme defaults to 'http'.

    static_configs:
      - targets: ["localhost:9090"]
  - job_name: "linux"
    static_configs:
      - targets: ['192.168.152.101:9100']
重启服务器端,即可
./prometheus --config.file=prometheus.yml
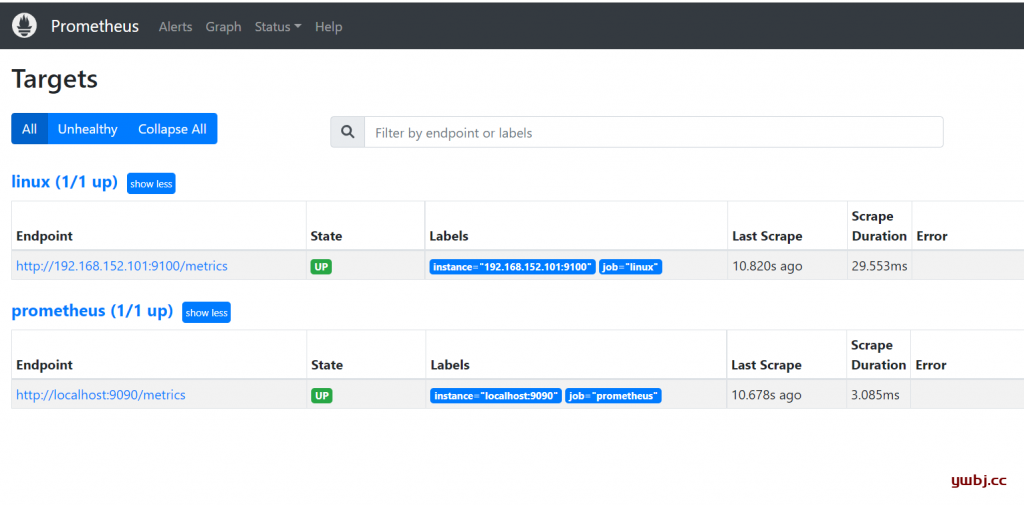
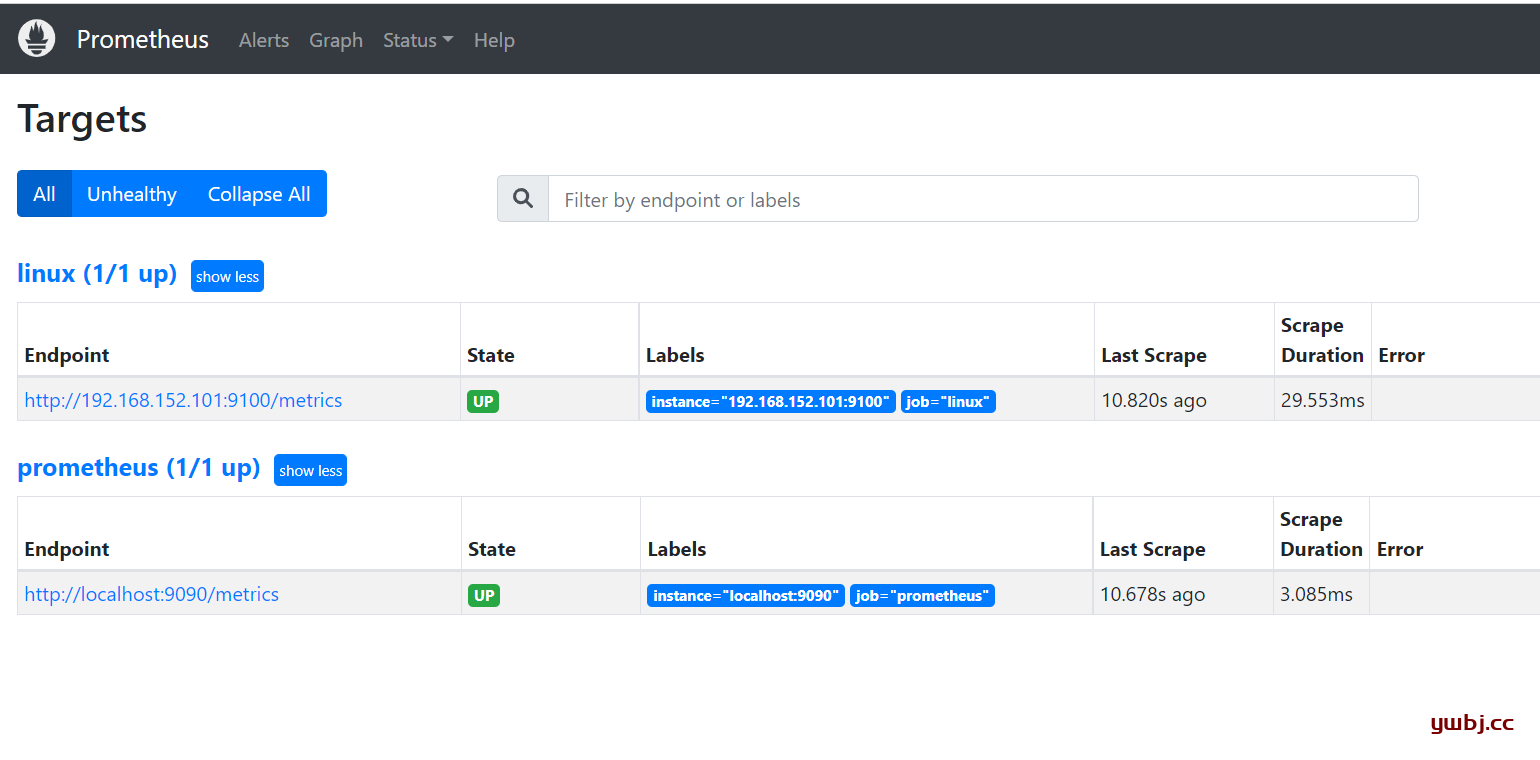
测试,查看是否添加成功,登录浏览器UI界面,在Status >> Targets 即可查看到所有客户端信息可服务器信息。
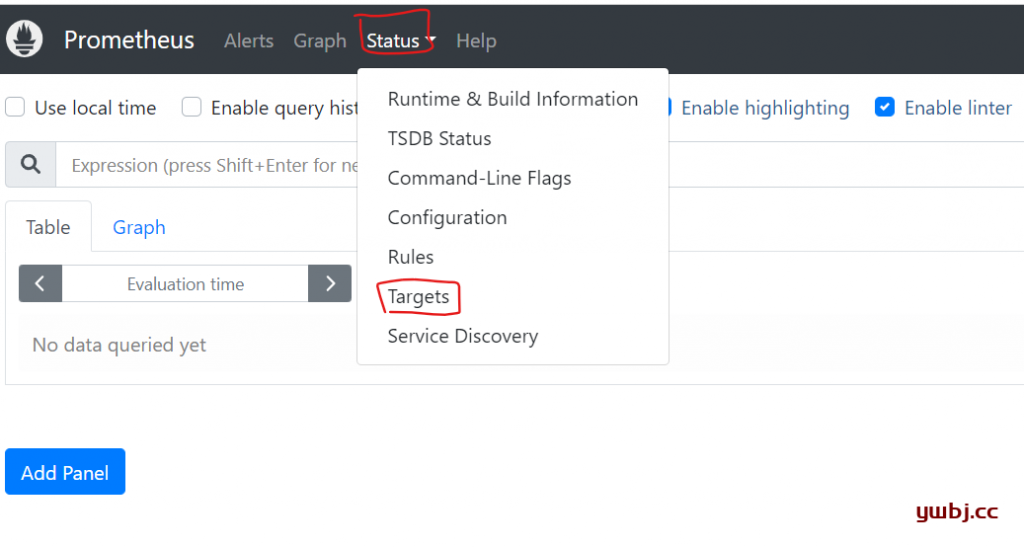
状态UP即可正常。
五、第三方界面安装
由于prometheus自带UI界面相对比较简陋,所以我们需要用到第三方工具Grafana在管理,这样更友好,更直观。
这里测试机器有限,所以也安装在192.168.152.103服务器端,你也可以安装在其他机器上面。
1:Grafana安装
官方安装文档:https://grafana.com/docs/grafana/next/setup-grafana/installation/debian/
选择自己合适的系统,可以选择企业版(Enterprise)或者开源版本(OSS),我这里为Ubuntu安装企业版,所以安装如下:
获得最新版key(企业版)
wget -q -O - https://packages.grafana.com/gpg.key | sudo apt-key add -
添加最新稳定版仓库
echo "deb https://packages.grafana.com/enterprise/deb stable main" | sudo tee -a /etc/apt/sources.list.d/grafana.list
如果想要安装最新的测试版,添加仓库如下
echo "deb https://packages.grafana.com/enterprise/deb beta main" | sudo tee -a /etc/apt/sources.list.d/grafana.list
最后更新,安装
sudo apt-get update
sudo apt-get install grafana-enterprise
当然你也可以安装开源版本OSS,文档也有配置,安装一样。
2:启动Grafana,并添加prometheus
启动Grafana,默认端口为3000.
sudo systemctl start grafana-server.service
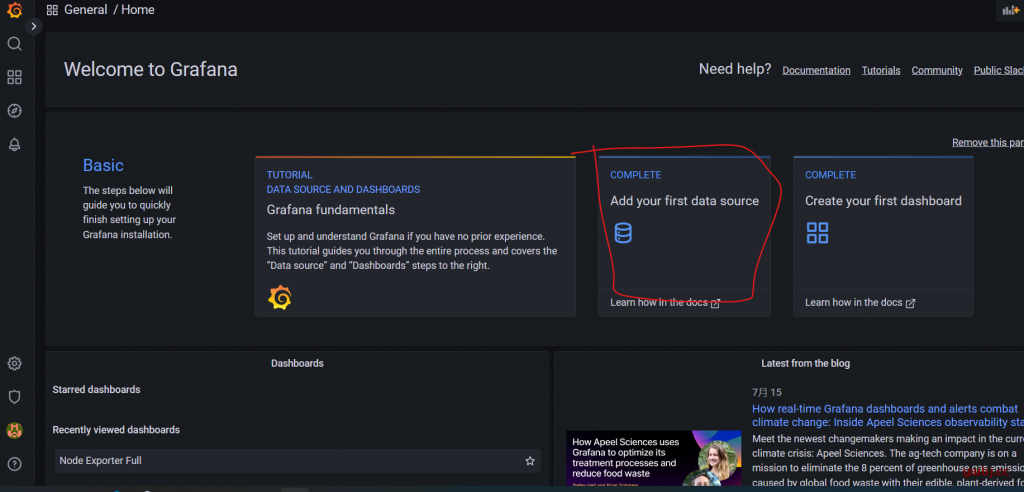
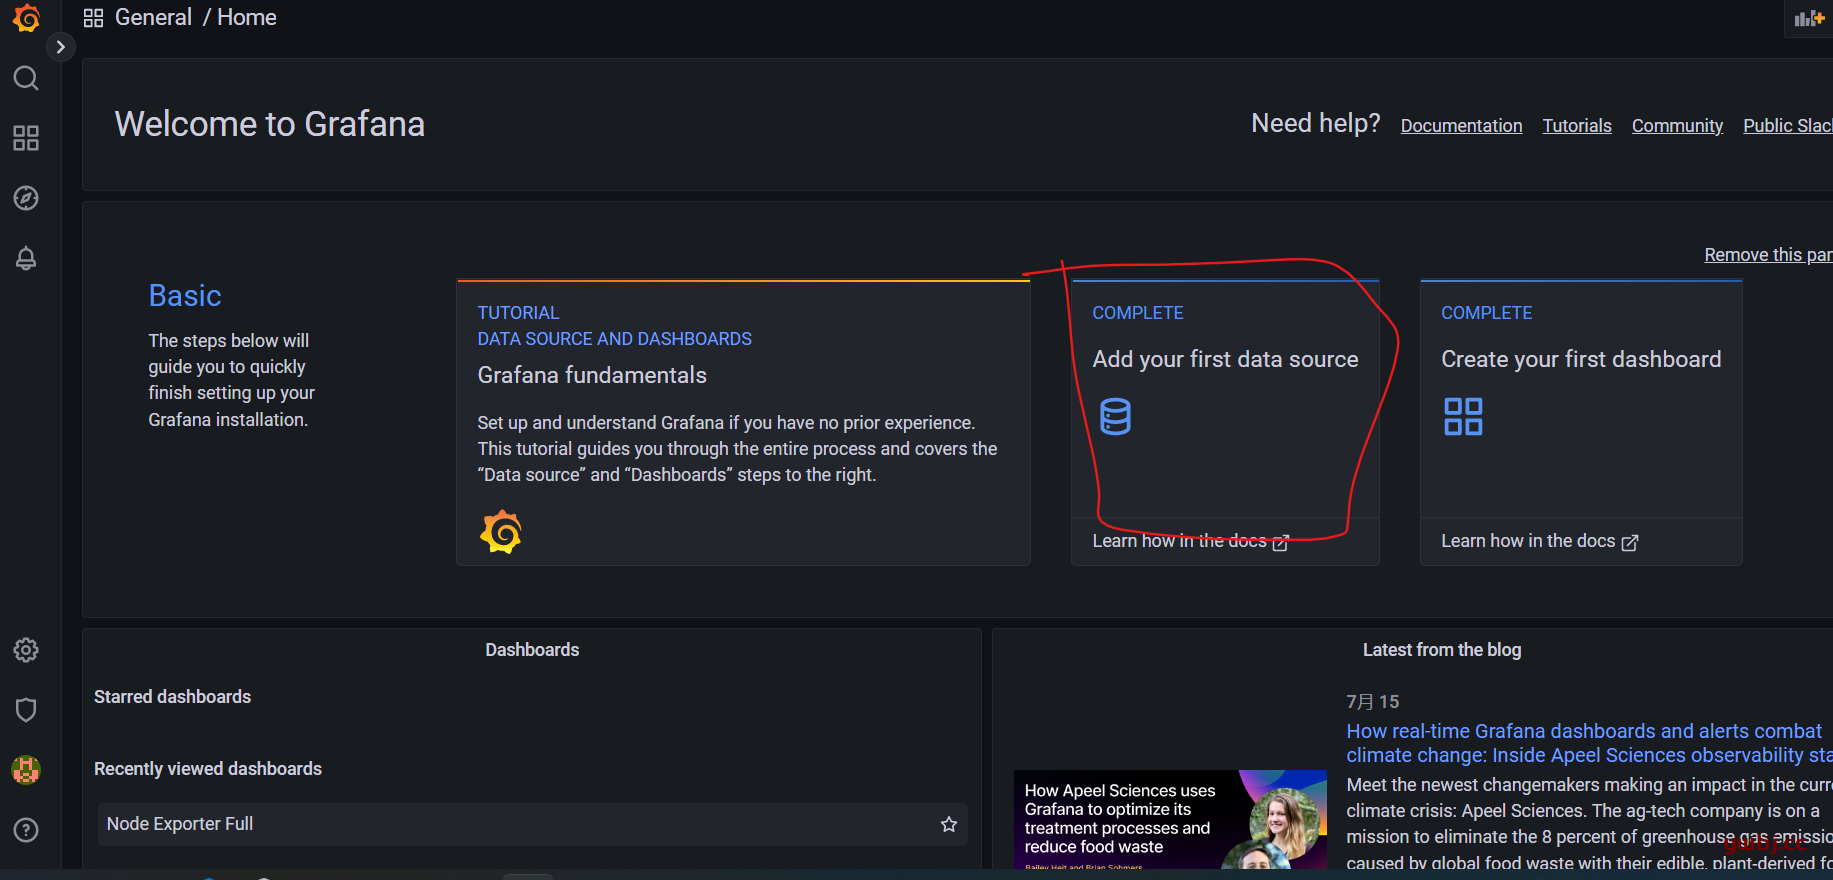
访问Grafana,登录http://192.168.152.103:3000/,默认账号密码:admin,admin
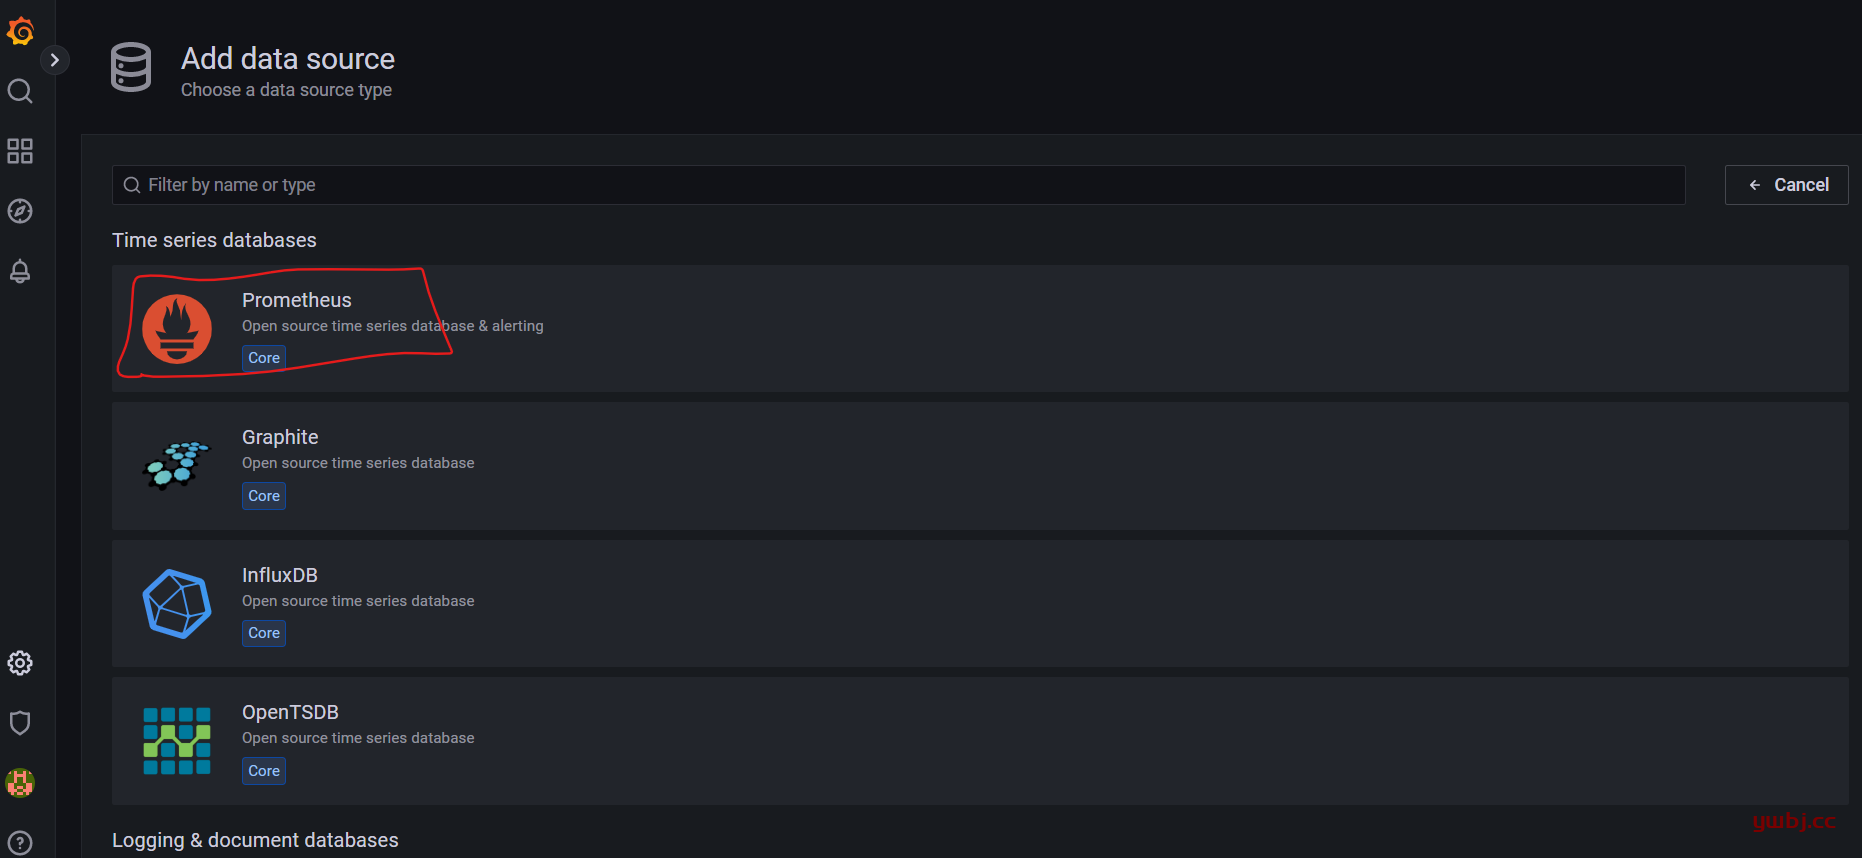
添加数据 add data source
选择prometheus
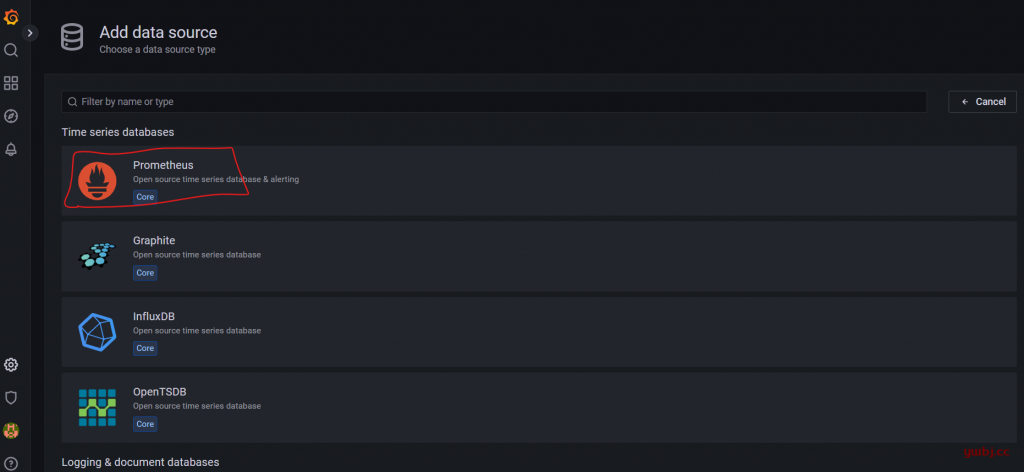
添加prometheus的服务器IP地址,默认端口为9090
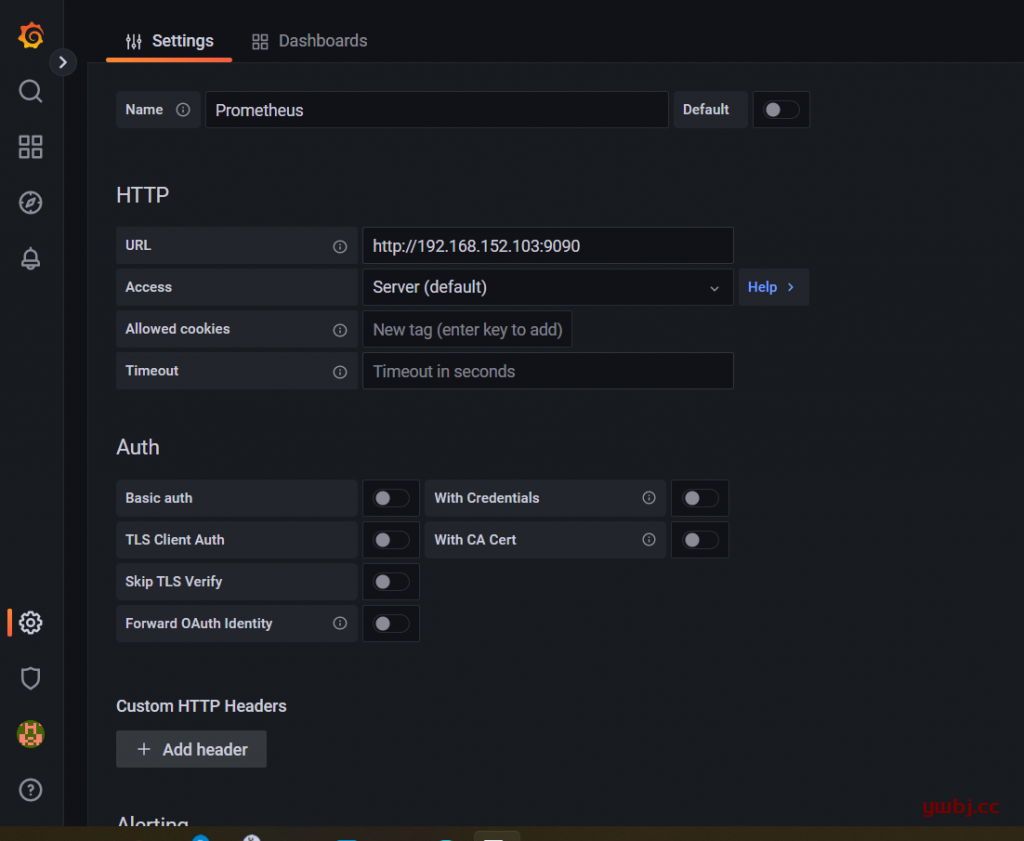
其他默认,保存即可。
保存完成后,在explore即可看到刚才添加的prometheus数据。
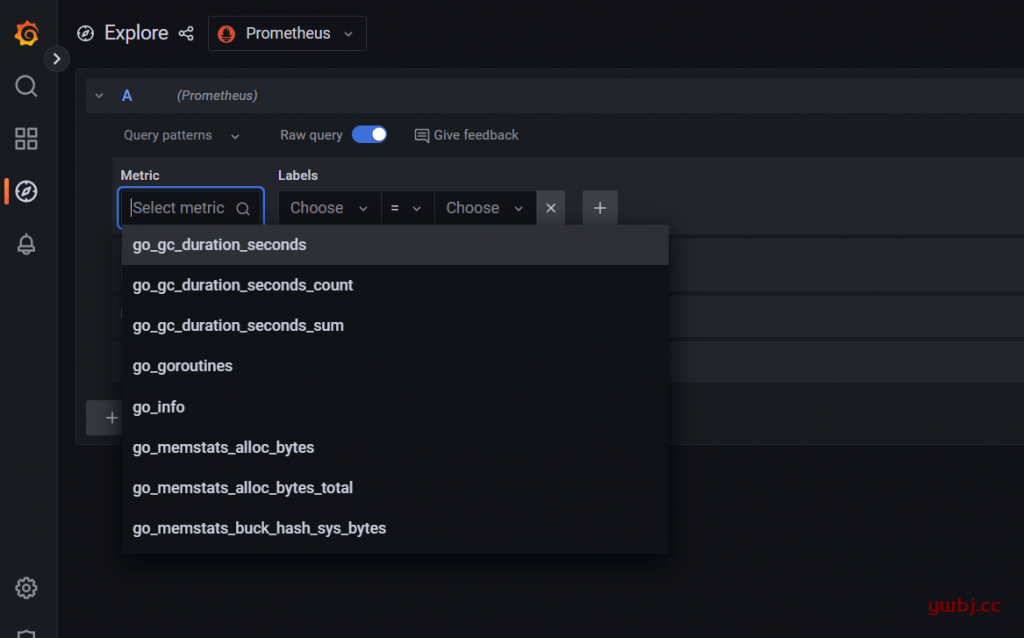
当然这时候,还是看不懂的,这时还需要下一步配置Dashboards界面,更加友好直观。
3:Grafana配置添加Dashboards
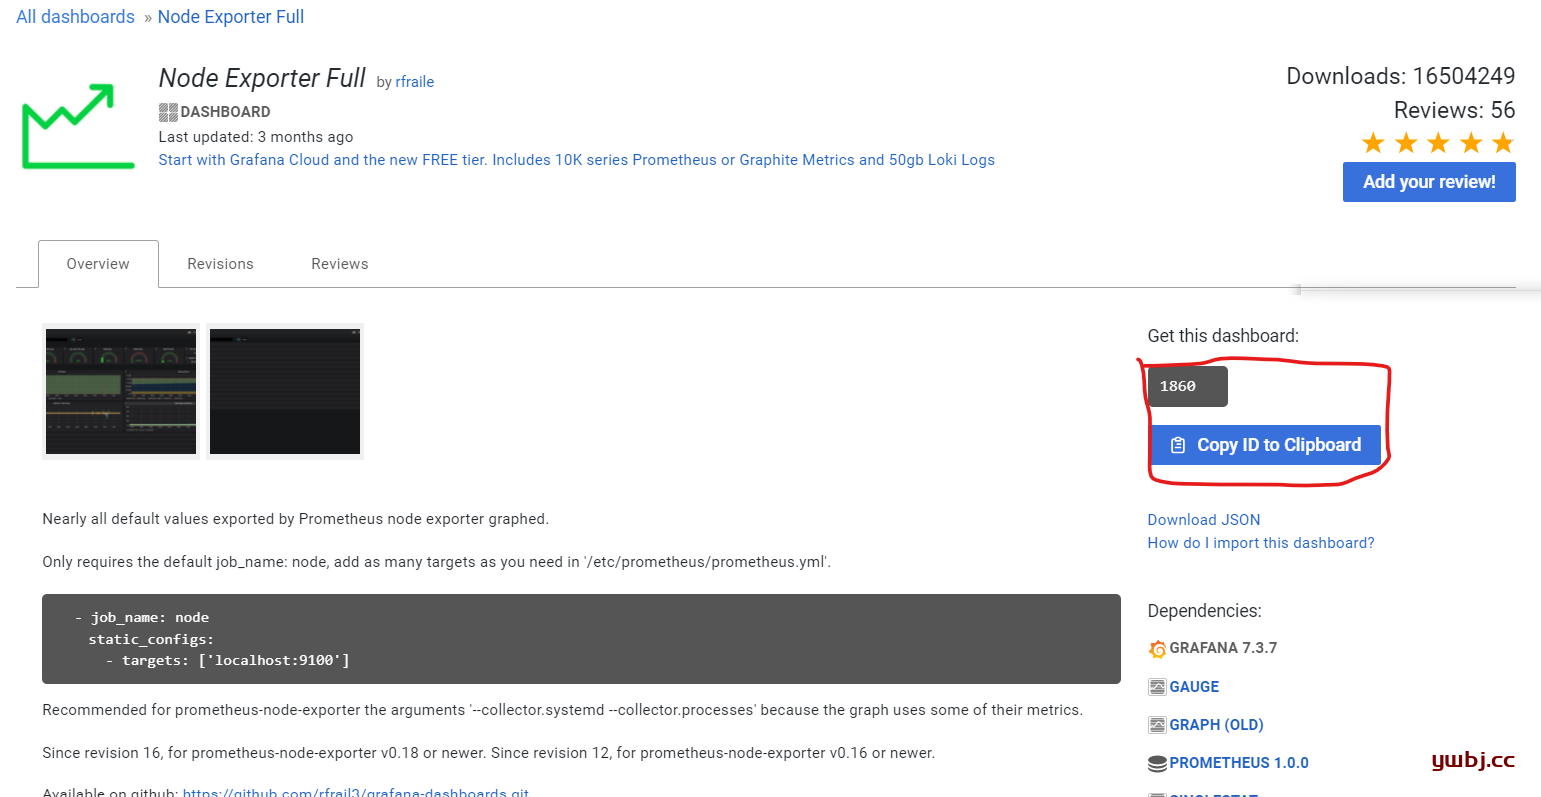
官方提供了很多模板,可以自己根据需求喜好来选择。当然只能选择prometheus的模板。
官方模块地址:https://grafana.com/grafana/dashboards/
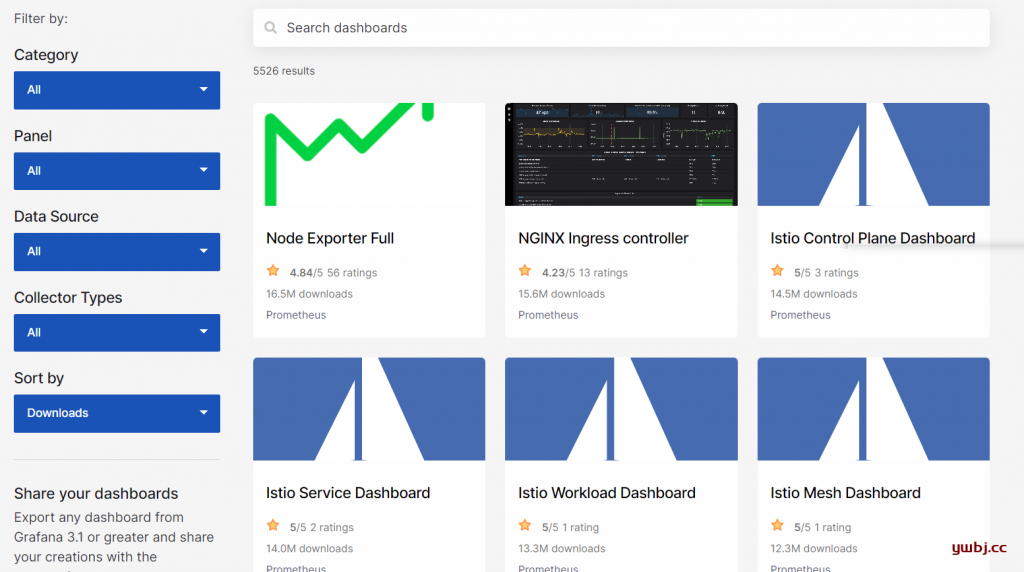
这里第1个就是prometheus的模板,看下载的人也最多,所以我就选择这个,点击进去。可以看到这个代号,复制即可,这个代号为1860。
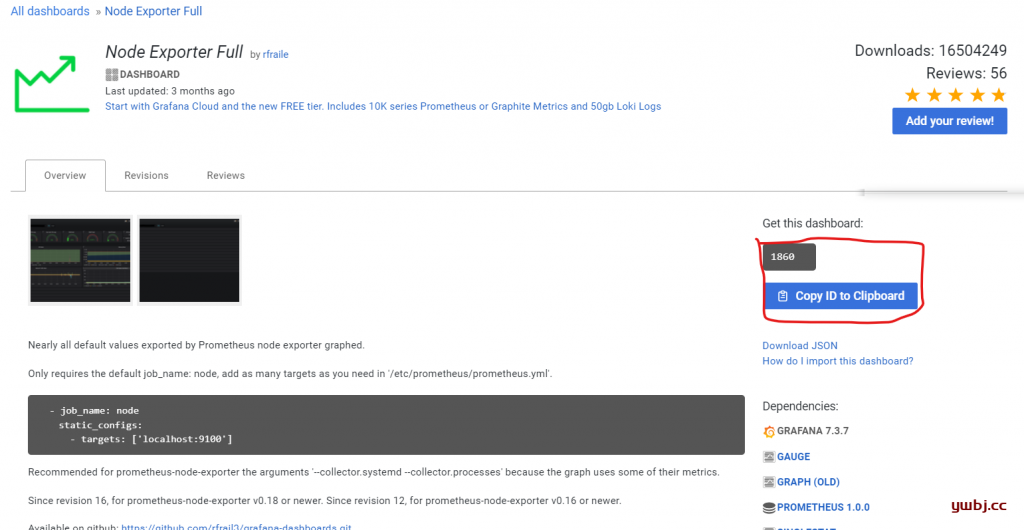
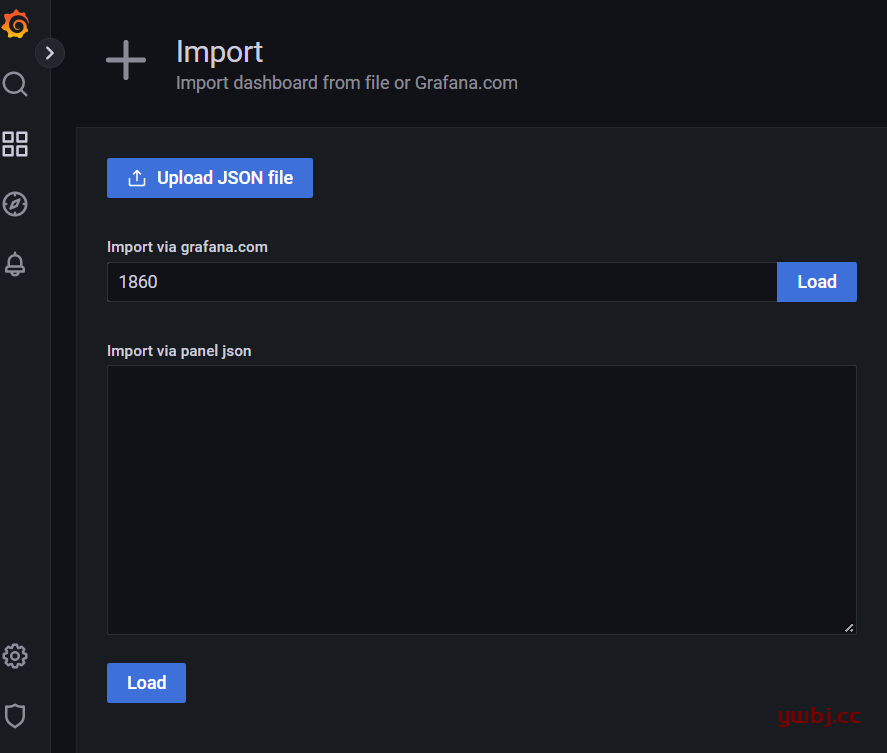
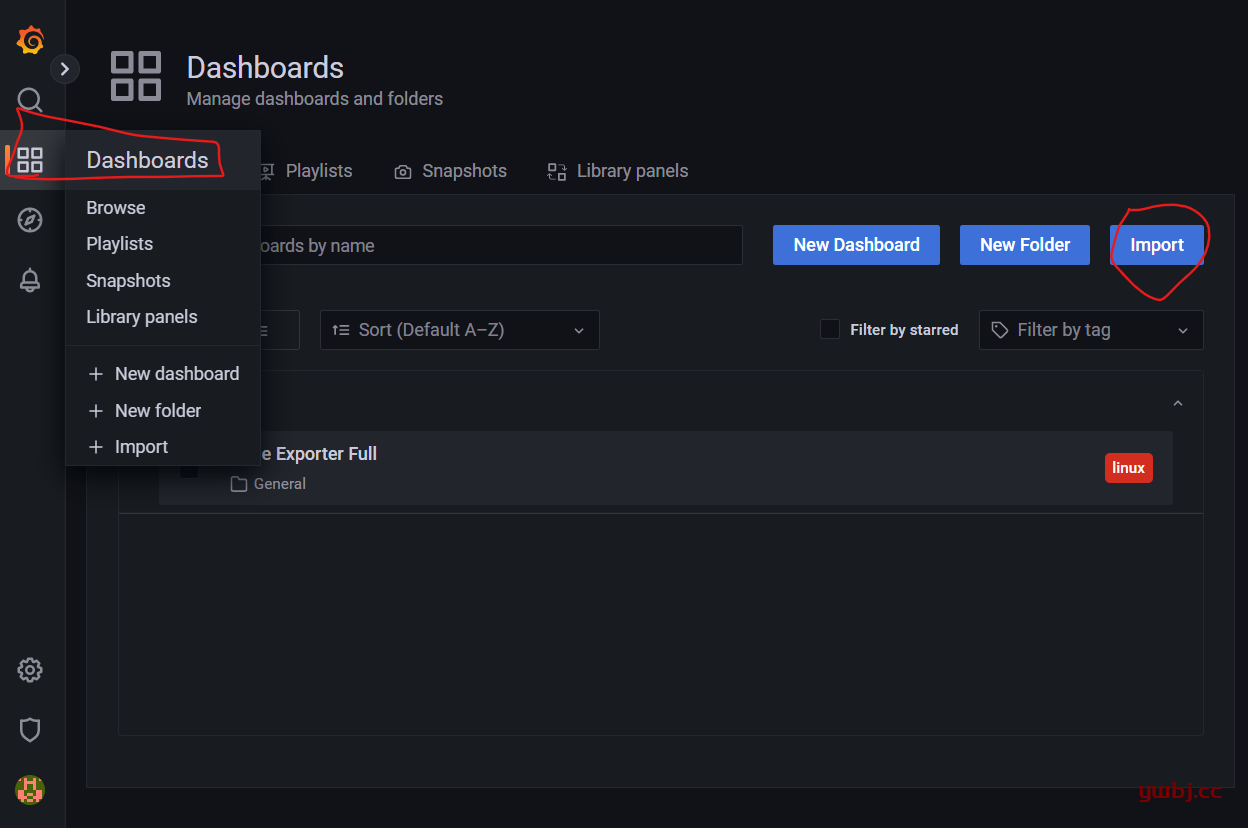
回到Grafana,在Dashboards中,选择Import导入即可。

填写1860,load即可完成。
添加完成后,即可按host和时间在选择图形观看了。
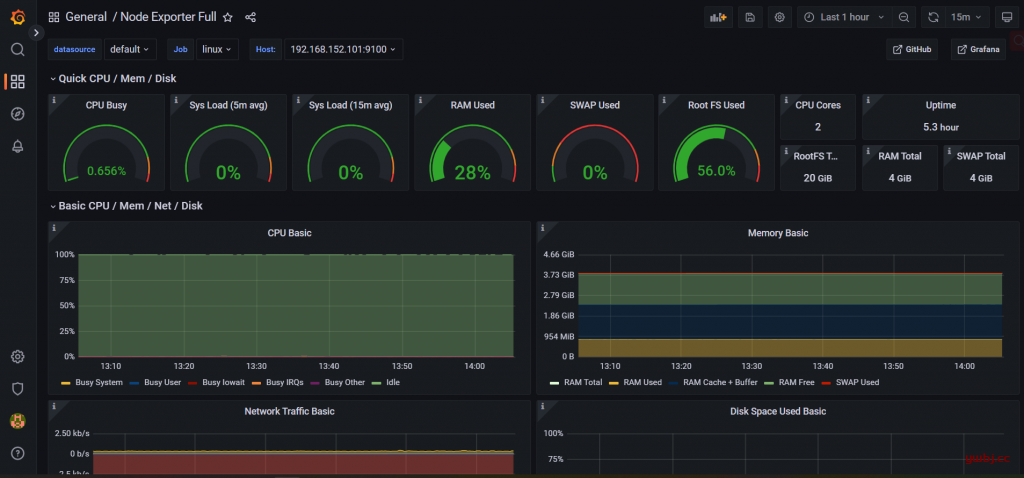
这里界面基本就配置完成了。
六、后台启动
配置完成,还需要配置后台启动,直接用nohup就行
服务器端:
#不保存日志
nohup ./prometheus --config.file=prometheus.yml >/dev/null 2>&1 &
#保存日志到/var/log/prometheus.log
nohup ./prometheus --config.file=prometheus.yml >/var/log/prometheus.log 2>&1 &
客户端:
#不保存日志
nohup ./node_exporter >/dev/null 2>&1 &
#保存日志到/var/log/node_exporter.log
nohup ./node_exporter >/var/log/node_exporter.log 2>&1 &
当然还可以把服务写进systemd,设置开机自启,可以自行研究。
下一步是告警发送的配置,会在下一篇文章介绍。
打赏作者
