目录
一:简介
日志监控告警系统,较为主流的是ELK(Elasticsearch 、 Logstash和Kibana核心套件构成),虽然优点是功能丰富,允许复杂的操作。但是,这些方案往往规模复杂,资源占用高,操作苦难。很多功能往往用不上,大多数查询只关注一定时间范围和一些简单的参数(如host、service等),使用这些解决方案就有点杀鸡用牛刀的感觉了。
所以寻找更轻量级的日志监控系统,所以也就有了EFK(elasticsearch+kibana+filebeat),
搭建参考:EFK轻量级日志系统搭建
另外一种是Promtail + Loki + Grafana核心组件构成,简称PLG,这种是更轻量级的,配置要求也不高,功能简单,但是目的明确,就是日志采集。
Loki的架构也非常简单,使用了和prometheus一样的标签来作为索引,Loki 是受Prometheus启发的水平可扩展、高可用、多租户日志聚合系统。
组件:
promtail: 日志收集的代理,安装部署在需要收集和分析日志的服务器,promtail会将日志发给Loki服务。
Loki: 主服务器,负责存储日志和处理查询。
Grafana:提供web管理界面,数据展示功能。
二:服务器安装及配置
1:基础安装启动
安装方式大概有这么几种,二进制安装,yum安装、docker安装、helm安装。
因为是服务器端,我这里用docker安装,简单方便。
官方网站也提供了docker-compose文件供下载。
参考地址:https://grafana.com/docs/loki/latest/installation/docker/
#下载docker-compose文件
wget https://raw.githubusercontent.com/grafana/loki/v2.5.0/production/docker-compose.yaml -O docker-compose.yaml
下载的docker-compose文件如下,也是最简单基本的。
version: "3"

networks:
  loki:

services:
  loki:
    image: grafana/loki:2.5.0
    ports:
      - "3100:3100"
    command: -config.file=/etc/loki/local-config.yaml
    networks:
      - loki

  promtail:
    image: grafana/promtail:2.5.0
    volumes:
      - /var/log:/var/log
    command: -config.file=/etc/promtail/config.yml
    networks:
      - loki

  grafana:
    image: grafana/grafana:latest
    ports:
      - "3000:3000"
    networks:
      - loki
这时也可以正常启动即可,默认日志为/var/log的位置。
docker-compose -f docker-compose.yaml up
这时,基本的安装就完成了,但是有时候需要更改配置文件,如后续nginx反向代理访问,这时这个配置文件满足不了需求,所以需要自己改动grafana。还有就是docker-compose down掉,数据也是没了,需要重新添加。
2:升级配置启动
更改也很简单,无非就是启动后,把docker的配置文件夹拷贝出来本地,然后挂载上去即可。
以下就是我自己改的docker-compose文件,可以参考:
本人机器3000端口被占用,所以改用3030端口映射,按需设置。还有本人数据文件夹/var/lib/grafana/挂载后,账号进不去,所以先注释掉了,后续在慢慢测试。
version: "3"

networks:
  loki:

services:
  loki:
    image: grafana/loki:2.5.0
    restart: unless-stopped
    ports:
      - "3100:3100"
    volumes:
      - ./config/loki/:/etc/loki/
    command: -config.file=/etc/loki/local-config.yaml
    networks:
      - loki

  promtail:
    image: grafana/promtail:2.5.0
    volumes:
      - /var/log:/var/log
      - ./config/promtail/:/etc/promtail/
    command: -config.file=/etc/promtail/config.yml
    networks:
      - loki

  grafana:
    image: grafana/grafana-enterprise:8.5.2-ubuntu
    restart: unless-stopped
    ports:
      - "3030:3000"
    volumes:
      - ./config/grafana/:/etc/grafana/
#      - ./grafana-data:/var/lib/grafana/
#这行是数据挂载在本地,需要将数据拷贝出来
    networks:
      - loki
最后文件结构如下:除了grafana配置文件夹比较多文件,其他都只有一个。grafana我整个文件夹复制出来就行了。
├── config
│   ├── grafana
│   │   ├── grafana.ini
│   │   ├── ldap.toml
│   │   └── provisioning
│   │       ├── access-control
│   │       ├── dashboards
│   │       ├── datasources
│   │       ├── notifiers
│   │       └── plugins
│   ├── loki
│   │   └── local-config.yaml
│   └── promtail
│       └── config.yml
├── docker-compose.yaml
└── grafana-data
    ├── alerting [error opening dir]
    ├── csv [error opening dir]
    ├── grafana.db
    ├── plugins
    └── png [error opening dir]
loki的local-config.yaml参考配置文件:
auth_enabled: false

server:
  http_listen_port: 3100

common:
  path_prefix: /loki
  storage:
    filesystem:
      chunks_directory: /loki/chunks
      rules_directory: /loki/rules
  replication_factor: 1
  ring:
    kvstore:
      store: inmemory

schema_config:
  configs:
    - from: 2020-10-24
      store: boltdb-shipper
      object_store: filesystem
      schema: v11
      index:
        prefix: index_
        period: 24h

ruler:
  alertmanager_url: http://localhost:9093

# By default, Loki will send anonymous, but uniquely-identifiable usage and configuration
# analytics to Grafana Labs. These statistics are sent to https://stats.grafana.org/
#
# Statistics help us better understand how Loki is used, and they show us performance
# levels for most users. This helps us prioritize features and documentation.
# For more information on what's sent, look at
# https://github.com/grafana/loki/blob/main/pkg/usagestats/stats.go
# Refer to the buildReport method to see what goes into a report.
#
# If you would like to disable reporting, uncomment the following lines:
#analytics:
#  reporting_enabled: false
promtail的config.yml配置文件:
server:
  http_listen_port: 9080
  grpc_listen_port: 0

positions:
  filename: /tmp/positions.yaml

clients:
  - url: http://loki:3100/loki/api/v1/push

scrape_configs:
- job_name: system
  static_configs:
  - targets:
      - localhost
    labels:
      job: varlogs
      __path__: /var/log/*log
grafana的配置文件太长,就不复制了,自己拷贝出来即可。
拷贝完配置文件夹后,更改完后,直接启动即可。
sudo docker-compose up -d
浏览器输入ip端口即可访问,我这里配置为ip:3030端口访问。
2:grafana的反向代理nginx配置,域名访问
grafana配置完后,默认是IP:端口的方式访问,如果需要域名访问,则需要用到nginx方向代理。
官方文档配置参考:https://grafana.com/tutorials/run-grafana-behind-a-proxy/
需要更改的配置文件为grafana.ini,去掉下面三个前面的注释。
- domain:你的域名,我这里为grafana.ywbj.cc
- root_url:访问连接,官方文档是后面加了grafana/,默认是没有的,也可以不加,区别是,不加直接访问网址即可,加了就需要访问域名/grafana才能访问,如:grafana.ywbj.cc/grafana/ 才能访问。我这里配置就没有加。
- serve_from_sub_path:去掉注释,将false改成true即可。
[server]
domain = grafana.ywbj.cc
root_url = %(protocol)s://%(domain)s:%(http_port)s/
serve_from_sub_path = true
grafana配置完成,下面就是配置nginx了。官方nginx配置文件:
注:如果上面root_url 后面加了grafana/,则location / 改为location /grafana/ 。
# this is required to proxy Grafana Live WebSocket connections.
map $http_upgrade $connection_upgrade {
  default upgrade;
  '' close;
}

server {
  listen 80;
  server_name  grafana.initcapp.com;
  root /usr/share/nginx/html;
  index index.html index.htm;

  location / {
    proxy_set_header Host $http_host;
    proxy_pass http://localhost:3000/;
  }

  # Proxy Grafana Live WebSocket connections.
  location /api/live {
    rewrite  ^/(.*)  /$1 break;
    proxy_http_version 1.1;
    proxy_set_header Upgrade $http_upgrade;
    proxy_set_header Connection $connection_upgrade;
    proxy_set_header Host $http_host;
    proxy_pass http://localhost:3000/;
  }
}
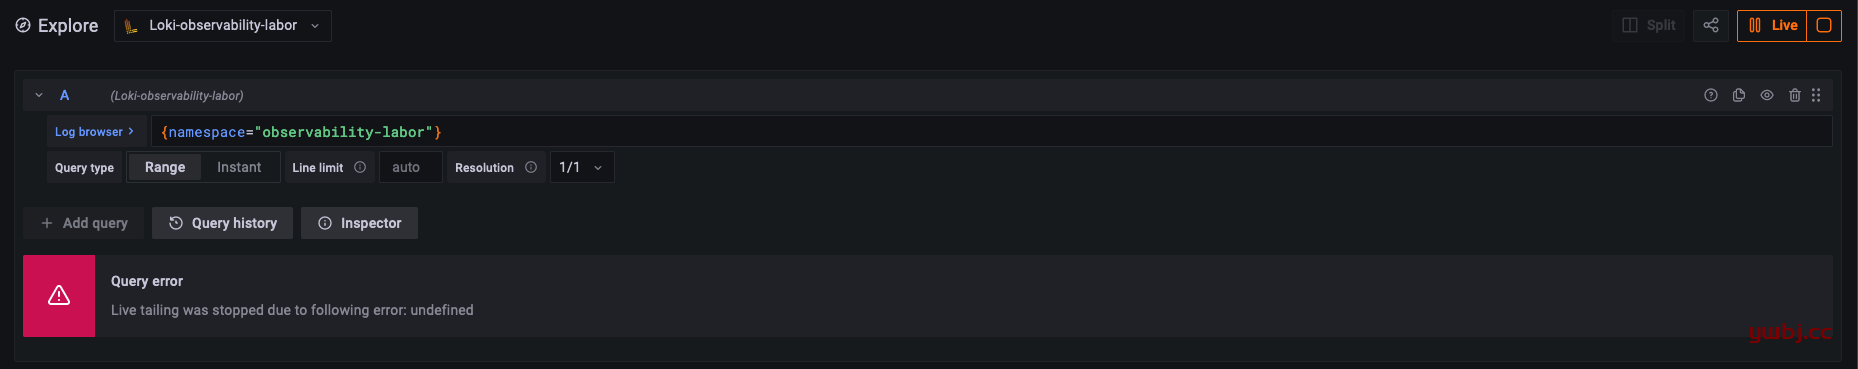
上面配置好了,然后启动,虽然可以访问,也可以添加资源,但是在实时查看日志流,会出现错误。
Query error Live tailing was stopped due to following error: undefined,如下图:
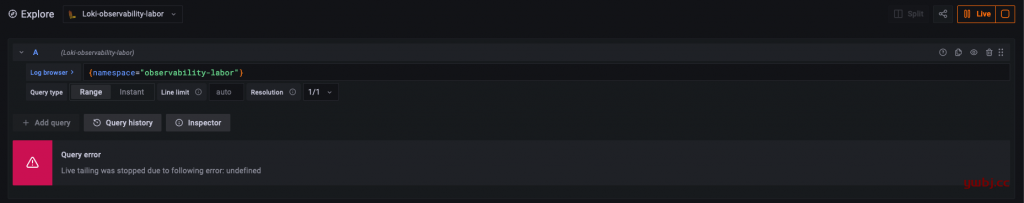
原因是websocket出错,即配置文件中location /api/live 这个区域。
根据另一篇官方文档:https://grafana.com/docs/grafana/latest/live/configure-grafana-live/
修改nginx配置文件,最后nginx配置文件为:
map $http_upgrade $connection_upgrade {
  default upgrade;
  '' close;
}

server {
  listen 80;
  server_name      grafana.ywbj.cc;
  #root /usr/share/nginx/html;
  #index index.html index.htm;

  error_log  /var/log/nginx/nginx.localhost.error.log  warn;

  location / {
    proxy_http_version 1.1;
    proxy_set_header Upgrade $http_upgrade;
    proxy_set_header Connection $connection_upgrade;
    proxy_set_header Host $http_host;
    proxy_pass http://localhost:3030/;
    #默认为3000端口,我配置为3030,所以是3030.
  }
这样启动后,功能一切正常了。
三:客户端安装及配置
loki客户端,及需要收集日志的另一台机器,只需要安装promtail,也可以docker启动安装,也可以二进制安装。
由于本人收集日志有其他目录,如果用docker,需要配置挂载很多路径到docker,所以我在客户端直接用二进制启动即可,配置文件比较容易。
二进制官方下载地址:https://github.com/grafana/loki/releases
找到自己合适的版本promtail,我这里是这个。
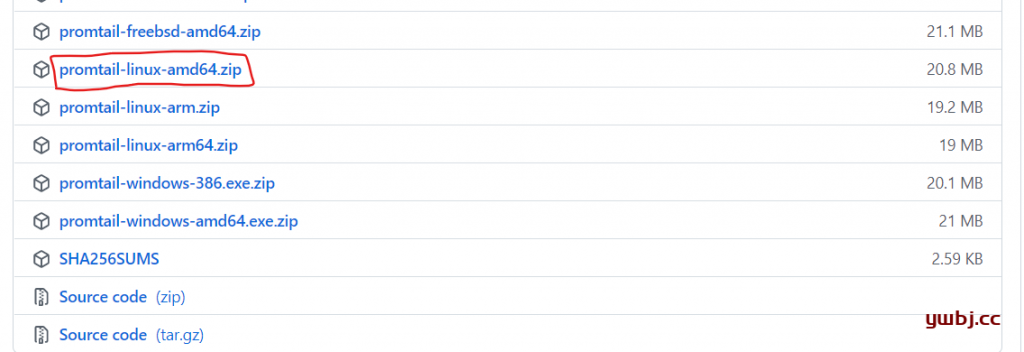
下载后,解压即可,得到一个可执行文件promtail-linux-amd64。
root@web:/loki# ls
config.yaml  promtail-linux-amd64
还需要创建一个config.yaml文件,用于启动promtail。
sudo vim config.yaml
如果有多路径及目录,则添加多个job_name即可。
注意:clients中的url为你服务器的地址。
server:
  http_listen_port: 9080
  grpc_listen_port: 0

positions:
  filename: /tmp/positions.yaml

clients:
  - url: http://192.168.152.100:3100/loki/api/v1/push
  #服务器端loki的IP地址

scrape_configs:
- job_name: web
  static_configs:
  - targets:
      - localhost
    labels:
      job: web-varlogs
      __path__: /var/log/*log

- job_name: web
  static_configs:
  - targets:
      - localhost
    labels:
      job: nginx-logs
      __path__: /home/ubuntu/laradock/logs/nginx/*log

- job_name: web
  static_configs:
  - targets:
      - localhost
    labels:
      job: api-logs
      __path__: /home/ubuntu/api/storage/logs/*log
创建完配置文件,启动即可。
./promtail-linux-amd64 -config.file=./config.yaml
后台启动,并输入日志。
#输入日志到指定位置
nohup ./promtail-linux-amd64 -config.file=./config.yaml  > /var/log/promtail.log 2>&1 &
#不需要日志输入,直接为空。
nohup ./promtail-linux-amd64 -config.file=./config.yaml  > /dev/null 2>&1 &
启动后,用ps可查看进程是否启动
root@web:/loki# ps -ef|grep promtail
root     1466400 1450430  7 10:41 pts/0    00:00:00 ./promtail-linux-amd64 -config.file=./config.yaml
root     1466415 1450430  0 10:41 pts/0    00:00:00 grep --color=auto promtail
四:grafana使用添加loki
在浏览器输入域名访问,默认账号密码为admin,admin
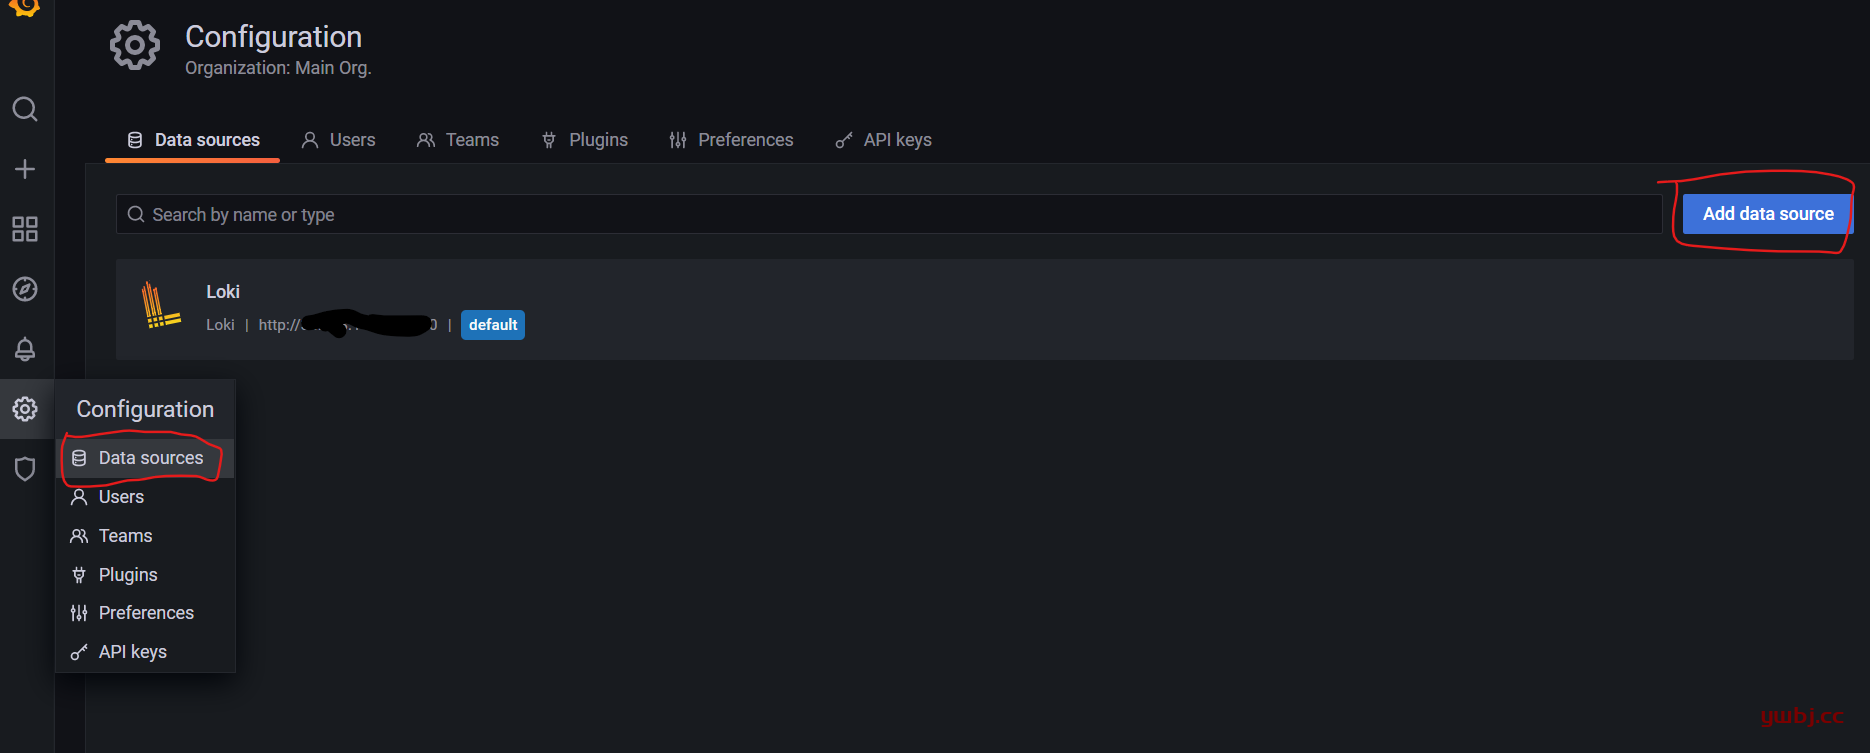
然后在data sources,点击添加add data source,选择loki即可。
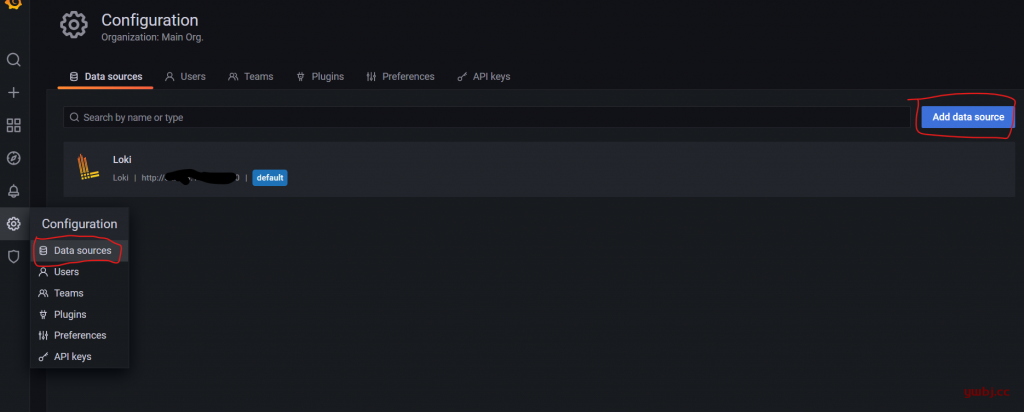
然后添加服务器loki的地址即可,地址为IP:3100,loki的默认端口为3100。
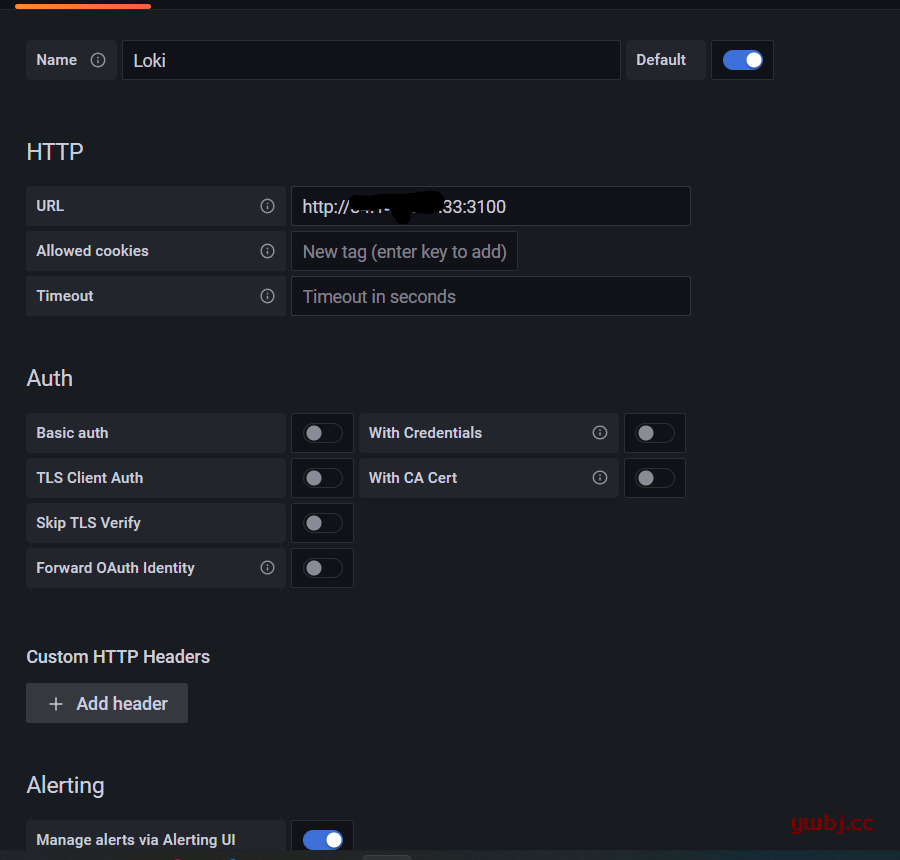
添加完成,没有报错,说明添加成功。
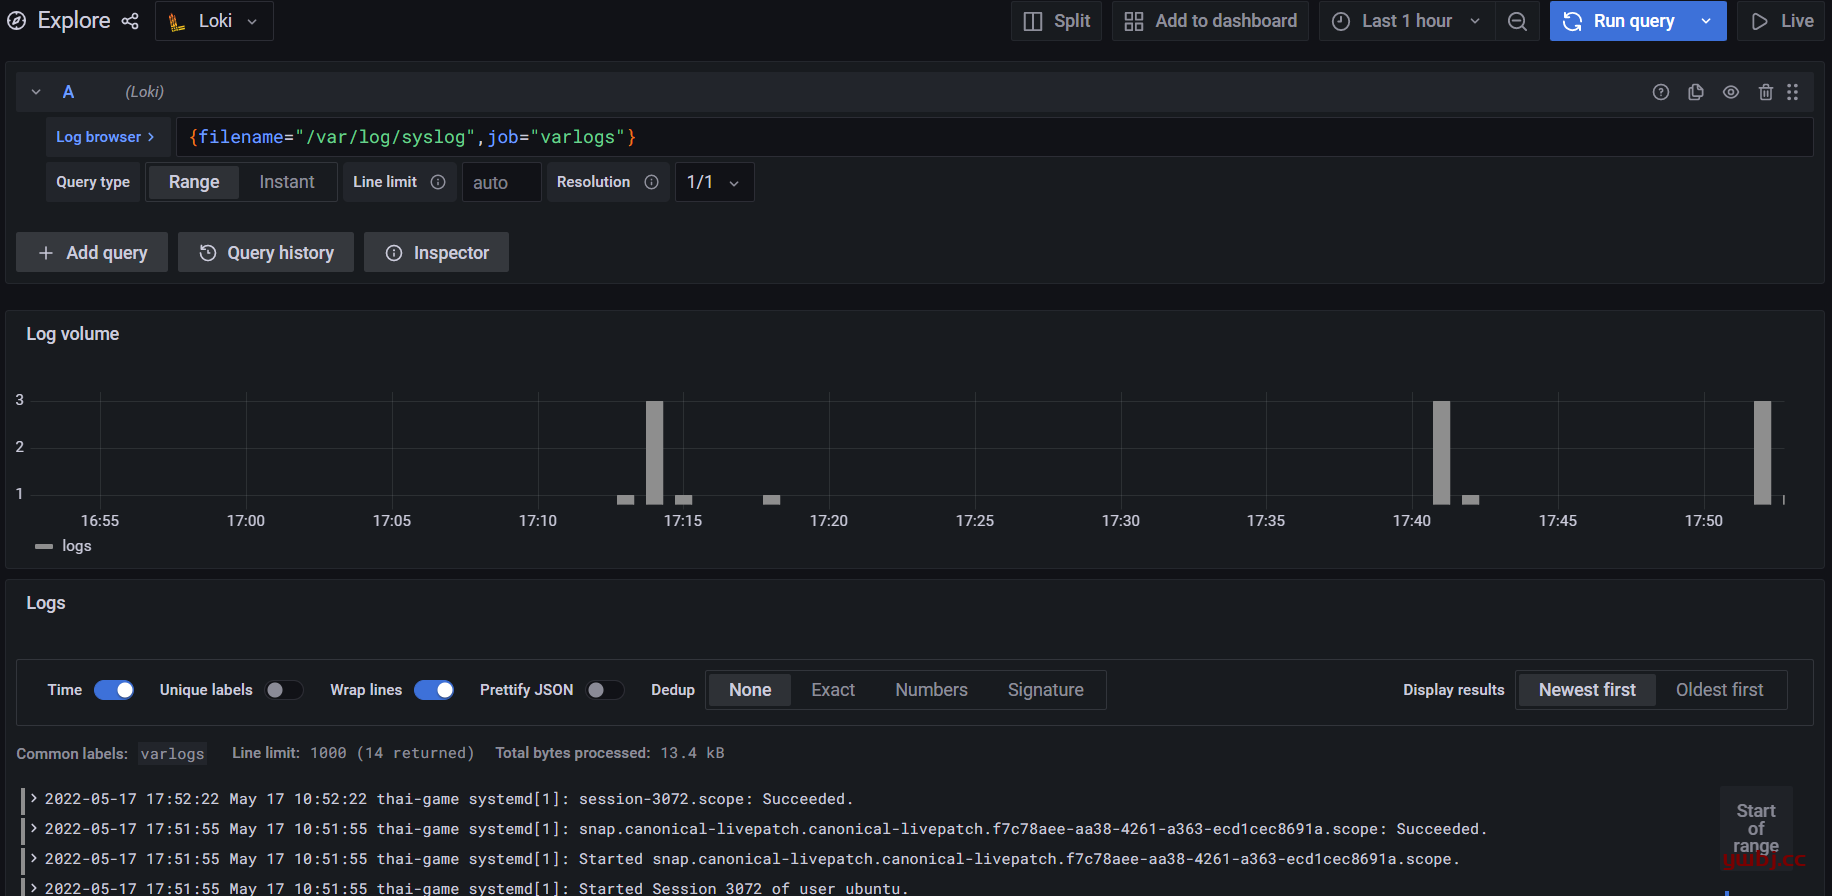
在explore,在 log browser中选择,即可查看刚才添加的日志,这里以job分类。
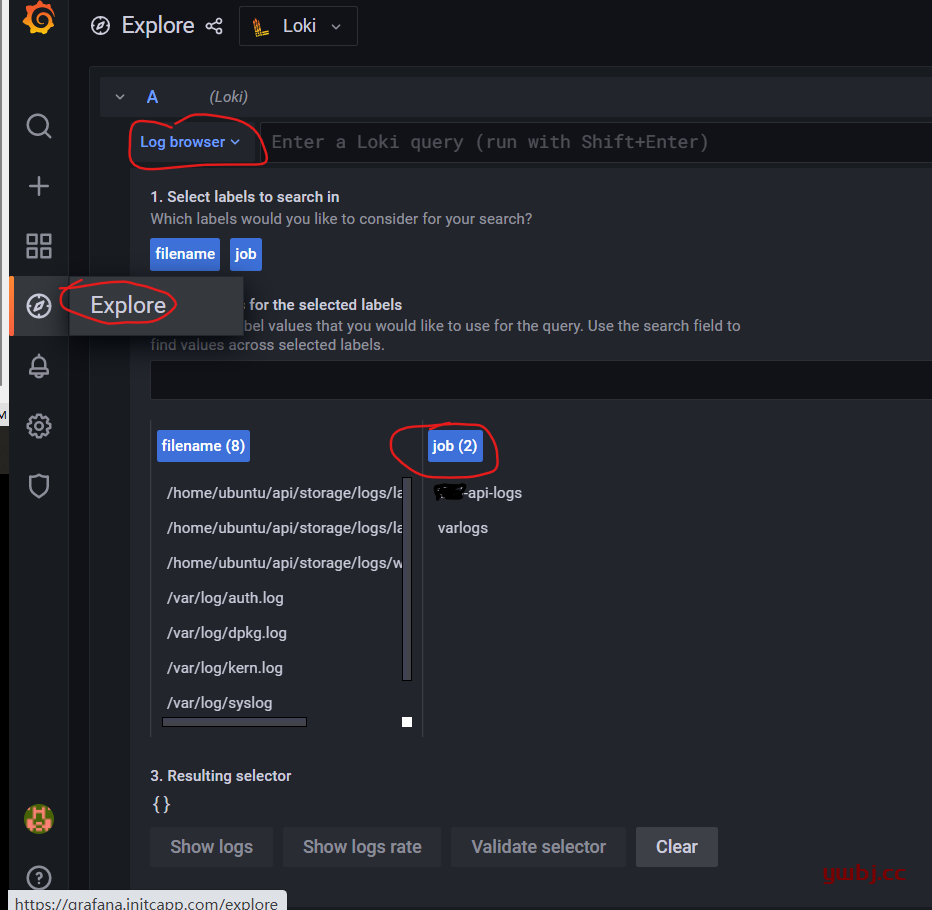
选择一个,show logs即可查看,右上角为实时流查看日志。

这里loki、promtail、Grafana日志系统就配置完了。


我搭建了一个比较简单的,发现日志并不能实时的上传,只有当输出日志的程序重启或者死掉以后,才会把日志文件里面的所有日志发送到loki,请问要怎么样才能实时监听日志文件中的日志?
不用啊,你用live试试,就可以实时查看啊,不用重启或者死掉的